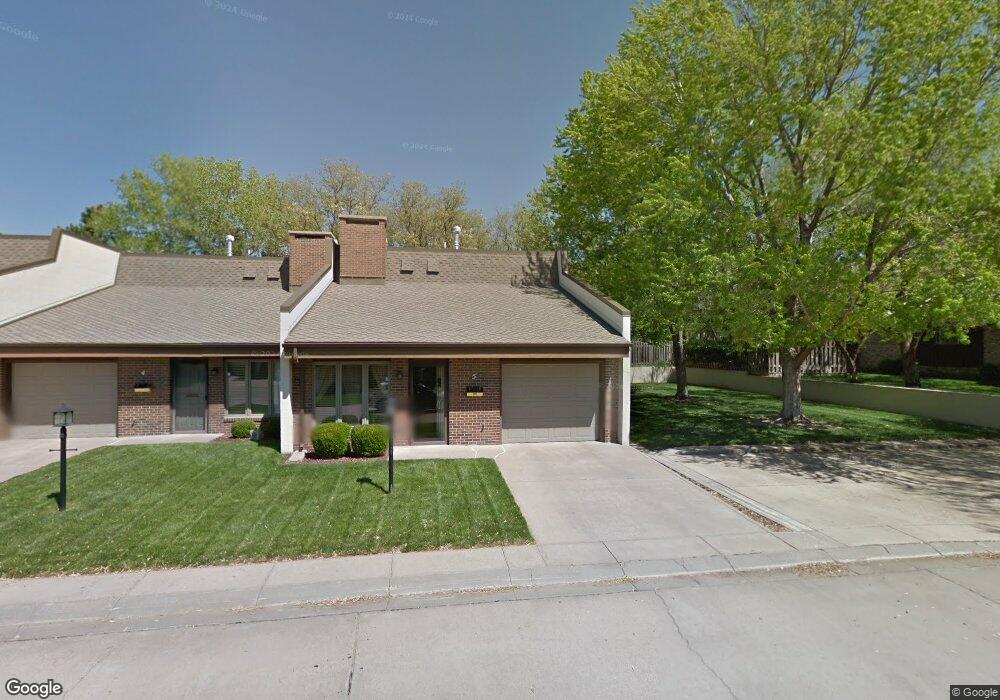
2110 N Belmont Place Unit 2 Garden City, KS 67846
Estimated Value: $221,000 - $293,000
2
Beds
2
Baths
1,667
Sq Ft
$146/Sq Ft
Est. Value
About This Home
This home is located at 2110 N Belmont Place Unit 2, Garden City, KS 67846 and is currently estimated at $244,119, approximately $146 per square foot. 2110 N Belmont Place Unit 2 is a home located in Finney County with nearby schools including Jennie Wilson Elementary School, Kenneth Henderson Middle School, and Charles O. Stones Intermediate Center.
Ownership History
Date
Name
Owned For
Owner Type
Purchase Details
Closed on
Mar 27, 2023
Sold by
Titus Danny
Bought by
Standley John S and Standley Barbara J
Current Estimated Value
Purchase Details
Closed on
Jun 21, 2018
Sold by
Browing Albena
Bought by
Titus Danny
Home Financials for this Owner
Home Financials are based on the most recent Mortgage that was taken out on this home.
Original Mortgage
$125,100
Interest Rate
4.5%
Mortgage Type
New Conventional
Purchase Details
Closed on
May 6, 2008
Sold by
Gates Tyler Cole
Bought by
Albena Browning Revocable Trust
Purchase Details
Closed on
Dec 10, 2005
Sold by
Lantaff Ronald J and Lantaff Dorothy J
Bought by
Gates Tyler Cole
Home Financials for this Owner
Home Financials are based on the most recent Mortgage that was taken out on this home.
Original Mortgage
$70,875
Interest Rate
6.3%
Mortgage Type
New Conventional
Create a Home Valuation Report for This Property
The Home Valuation Report is an in-depth analysis detailing your home's value as well as a comparison with similar homes in the area
Home Values in the Area
Average Home Value in this Area
Purchase History
| Date | Buyer | Sale Price | Title Company |
|---|---|---|---|
| Standley John S | -- | -- | |
| Titus Danny | $139,000 | Security 1St Title | |
| Albena Browning Revocable Trust | -- | None Available | |
| Gates Tyler Cole | -- | None Available |
Source: Public Records
Mortgage History
| Date | Status | Borrower | Loan Amount |
|---|---|---|---|
| Previous Owner | Titus Danny | $125,100 | |
| Previous Owner | Gates Tyler Cole | $70,875 |
Source: Public Records
Tax History Compared to Growth
Tax History
| Year | Tax Paid | Tax Assessment Tax Assessment Total Assessment is a certain percentage of the fair market value that is determined by local assessors to be the total taxable value of land and additions on the property. | Land | Improvement |
|---|---|---|---|---|
| 2024 | $3,847 | $23,857 | $0 | $23,857 |
| 2023 | $3,847 | $21,705 | $0 | $21,705 |
| 2022 | $3,197 | $19,930 | $0 | $19,930 |
| 2021 | $2,977 | $18,284 | $0 | $18,284 |
| 2020 | $2,922 | $18,267 | $0 | $18,267 |
| 2019 | $2,760 | $17,588 | $0 | $17,588 |
| 2018 | $2,680 | $17,156 | $0 | $17,156 |
| 2017 | $2,626 | $0 | $0 | $0 |
| 2016 | $2,469 | $0 | $0 | $0 |
| 2015 | $2,523 | $0 | $0 | $0 |
| 2012 | -- | $0 | $0 | $0 |
Source: Public Records
Map
Nearby Homes
- 2106 N Belmont Place Unit 4
- 2010 N Belmont Place
- 807 E Price St
- 610 E Price St
- 624 Briar Hill Dr
- 2504 N Carriage Ln
- 2505 N Carriage Ln
- 2001 Bison Dr
- 1101 E Mary St
- 1706 Prairie Park Ln
- 2303 N 3rd St
- 1517 E Johnson St
- 1709 Parkwood Ln
- 1505 E Melanie Ln
- 2008 N Antler Ridge Dr
- 2617 N Coachman Ln
- 1221 N Belmont Place
- 106 E Hamline St
- 1810 N Koster St
- 1710 E Crestway Dr
- 2110 N Belmont Place Unit 4
- 2110 N Belmont Place Unit 3
- 2110 N Belmont Place Unit 1
- 2110 N Belmont Place Unit 5
- 2110 N Belmont Place
- 2106 N Belmont Place Unit 3
- 2106 N Belmont Place
- 2106 N Belmont Place Unit 1
- 2106 N Belmont Place Unit 5
- 2204 N Belmont Place
- 2203 Center St
- 2105 N Belmont Place
- 2113 Center #4 St
- 1103 E Fair St Unit 4
- 1103 E Fair St Unit 3
- 1103 E Fair St Unit 2
- 1103 E Fair St Unit 1
- 1103 E Fair St Unit 5
- 1103 E Fair St
- 2201 Center St