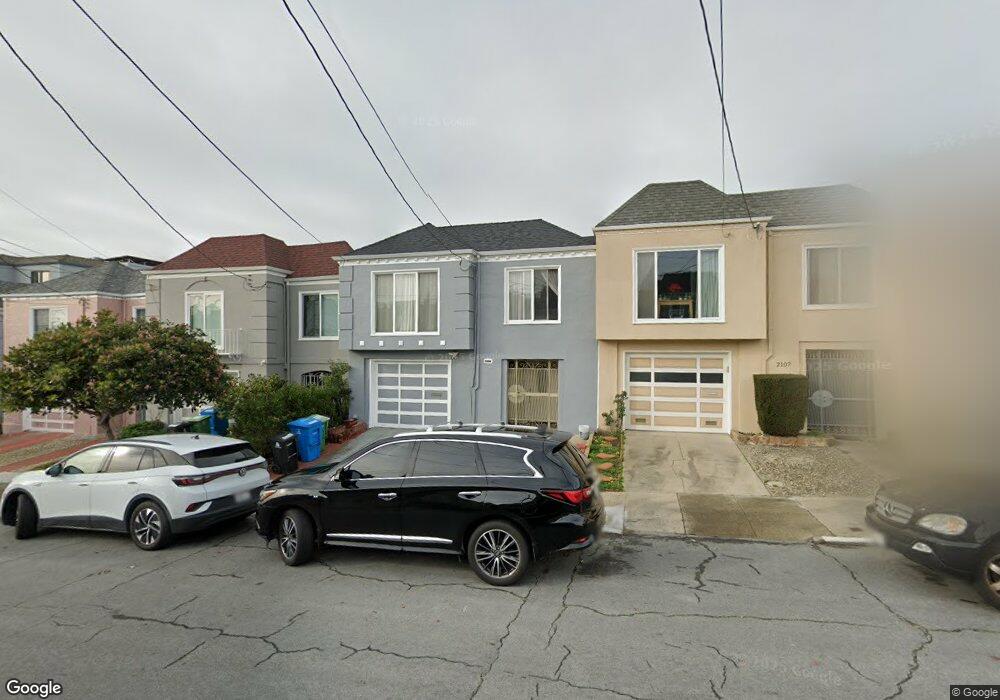
2111 33rd Ave San Francisco, CA 94116
Parkside NeighborhoodEstimated Value: $1,280,000 - $1,477,000
2
Beds
1
Bath
1,162
Sq Ft
$1,195/Sq Ft
Est. Value
About This Home
This home is located at 2111 33rd Ave, San Francisco, CA 94116 and is currently estimated at $1,388,576, approximately $1,194 per square foot. 2111 33rd Ave is a home located in San Francisco County with nearby schools including Stevenson (Robert Louis) Elementary School, Giannini (A.P.) Middle School, and St. Gabriel School.
Ownership History
Date
Name
Owned For
Owner Type
Purchase Details
Closed on
Aug 30, 2023
Sold by
Pei Kendy and Pei Chanh
Bought by
Kendy Pei And Chanh Pei Joint Living Trust and Pei
Current Estimated Value
Purchase Details
Closed on
Jul 27, 1995
Sold by
Li George Jau Tsun
Bought by
Pei Kendy and Sitpraseuth Chanh
Home Financials for this Owner
Home Financials are based on the most recent Mortgage that was taken out on this home.
Original Mortgage
$230,400
Interest Rate
7.71%
Purchase Details
Closed on
Oct 6, 1993
Sold by
Li Jen Huey
Bought by
Li George Jau Tsun
Home Financials for this Owner
Home Financials are based on the most recent Mortgage that was taken out on this home.
Original Mortgage
$136,000
Interest Rate
6.48%
Create a Home Valuation Report for This Property
The Home Valuation Report is an in-depth analysis detailing your home's value as well as a comparison with similar homes in the area
Home Values in the Area
Average Home Value in this Area
Purchase History
| Date | Buyer | Sale Price | Title Company |
|---|---|---|---|
| Kendy Pei And Chanh Pei Joint Living Trust | -- | None Listed On Document | |
| Pei Kendy | -- | None Listed On Document | |
| Pei Kendy | $288,000 | Fidelity National Title | |
| Li George Jau Tsun | -- | Fidelity National Title Co | |
| Li George Jau Tsun | -- | Chicago Title Company |
Source: Public Records
Mortgage History
| Date | Status | Borrower | Loan Amount |
|---|---|---|---|
| Previous Owner | Pei Kendy | $230,400 | |
| Previous Owner | Li George Jau Tsun | $136,000 |
Source: Public Records
Tax History Compared to Growth
Tax History
| Year | Tax Paid | Tax Assessment Tax Assessment Total Assessment is a certain percentage of the fair market value that is determined by local assessors to be the total taxable value of land and additions on the property. | Land | Improvement |
|---|---|---|---|---|
| 2025 | $6,284 | $478,416 | $282,403 | $196,013 |
| 2024 | $6,284 | $469,036 | $276,866 | $192,170 |
| 2023 | $6,181 | $459,840 | $271,438 | $188,402 |
| 2022 | $6,051 | $450,824 | $266,116 | $184,708 |
| 2021 | $5,940 | $441,986 | $260,899 | $181,087 |
| 2020 | $6,033 | $437,455 | $258,224 | $179,231 |
| 2019 | $5,782 | $428,878 | $253,161 | $175,717 |
| 2018 | $5,589 | $420,470 | $248,198 | $172,272 |
| 2017 | $5,224 | $412,227 | $243,332 | $168,895 |
| 2016 | $5,118 | $404,145 | $238,561 | $165,584 |
| 2015 | $5,053 | $398,075 | $234,978 | $163,097 |
| 2014 | $4,921 | $390,279 | $230,376 | $159,903 |
Source: Public Records
Map
Nearby Homes