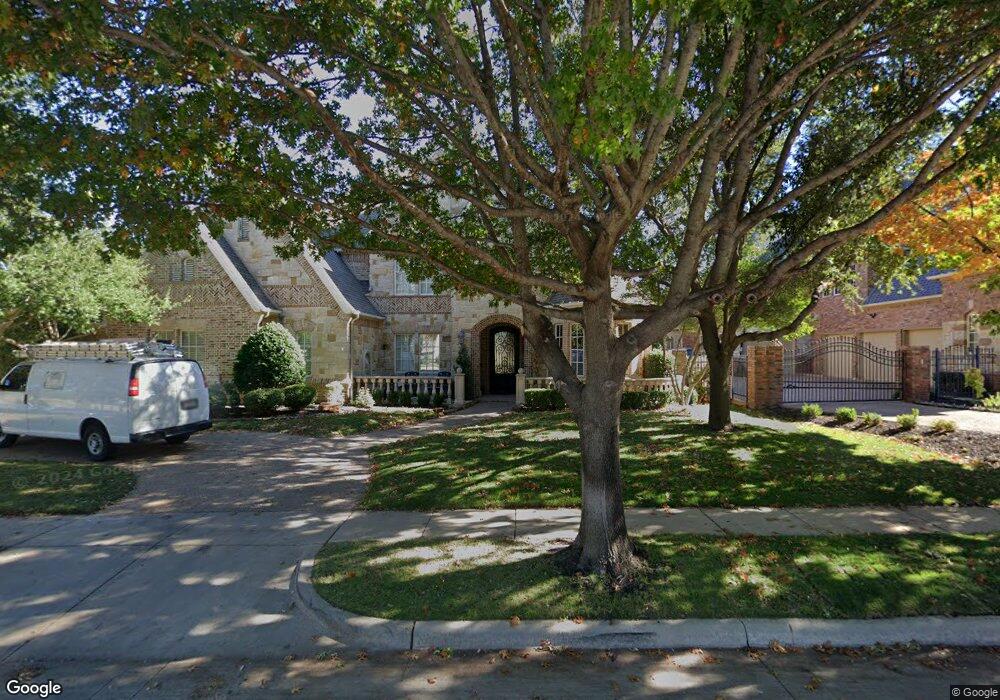
2113 Estes Park Rd Southlake, TX 76092
Estimated Value: $1,992,000 - $2,198,000
5
Beds
6
Baths
5,370
Sq Ft
$391/Sq Ft
Est. Value
About This Home
This home is located at 2113 Estes Park Rd, Southlake, TX 76092 and is currently estimated at $2,100,969, approximately $391 per square foot. 2113 Estes Park Rd is a home located in Tarrant County with nearby schools including Jack D. Johnson Elementary, Don T. Durham Intermediate School, and Carroll Middle School.
Ownership History
Date
Name
Owned For
Owner Type
Purchase Details
Closed on
Sep 23, 2020
Sold by
Gilpin Daniel E and Gilpin Kristin P
Bought by
Gilpin Daniel and Gilpin Kristin
Current Estimated Value
Purchase Details
Closed on
Apr 15, 2016
Sold by
Sheehan James M and Sheehan Donna
Bought by
Gilpin Daniel E and Gilpin Kristin P
Home Financials for this Owner
Home Financials are based on the most recent Mortgage that was taken out on this home.
Original Mortgage
$972,000
Interest Rate
2.62%
Mortgage Type
Adjustable Rate Mortgage/ARM
Purchase Details
Closed on
Mar 15, 2006
Sold by
S G Bruton Inc
Bought by
Sheehan James M
Home Financials for this Owner
Home Financials are based on the most recent Mortgage that was taken out on this home.
Original Mortgage
$700,000
Interest Rate
6.19%
Mortgage Type
Fannie Mae Freddie Mac
Create a Home Valuation Report for This Property
The Home Valuation Report is an in-depth analysis detailing your home's value as well as a comparison with similar homes in the area
Home Values in the Area
Average Home Value in this Area
Purchase History
| Date | Buyer | Sale Price | Title Company |
|---|---|---|---|
| Gilpin Daniel | -- | None Available | |
| Gilpin Daniel E | -- | Stewart | |
| Sheehan James M | -- | First American Title Co |
Source: Public Records
Mortgage History
| Date | Status | Borrower | Loan Amount |
|---|---|---|---|
| Previous Owner | Gilpin Daniel E | $972,000 | |
| Previous Owner | Sheehan James M | $700,000 |
Source: Public Records
Tax History Compared to Growth
Tax History
| Year | Tax Paid | Tax Assessment Tax Assessment Total Assessment is a certain percentage of the fair market value that is determined by local assessors to be the total taxable value of land and additions on the property. | Land | Improvement |
|---|---|---|---|---|
| 2025 | $24,865 | $1,839,882 | $334,500 | $1,505,382 |
| 2024 | $24,865 | $1,839,882 | $334,500 | $1,505,382 |
| 2023 | $26,533 | $1,933,048 | $334,500 | $1,598,548 |
| 2022 | $28,550 | $1,428,023 | $223,000 | $1,205,023 |
| 2021 | $27,430 | $1,203,067 | $223,000 | $980,067 |
| 2020 | $26,811 | $1,166,398 | $200,700 | $965,698 |
| 2019 | $27,259 | $1,125,717 | $250,000 | $875,717 |
| 2018 | $27,595 | $1,198,041 | $250,000 | $948,041 |
| 2017 | $29,443 | $1,187,856 | $220,000 | $967,856 |
| 2016 | $25,907 | $1,045,208 | $220,000 | $825,208 |
| 2015 | $24,611 | $1,034,400 | $100,000 | $934,400 |
| 2014 | $24,611 | $1,034,400 | $100,000 | $934,400 |
Source: Public Records
Map
Nearby Homes
- 1013 Winfield Ct
- 424 Saint Tropez Dr
- 2112 Beaver Creek Ln
- 212 Saint Tropez Dr
- 1828 Riviera Ln
- 1018 Quail Run Rd
- 1820 Riviera Ln
- 1812 Riviera Ln
- 208 Saint Tropez Dr
- 1836 Riviera Ln
- 1816 Riviera Ln
- 1821 Cannes Cir
- 1829 Cannes Cir
- 100 La Rambla Ct
- 116 La Rambla Ct
- 217 La Rambla Ct
- 209 La Rambla Ct
- 225 Murano Place
- 213 La Rambla Ct
- 124 La Rambla Ct
- 2109 Estes Park Rd
- 775 Castle Rock Dr
- 2117 Estes Park Rd
- 2112 Cheyenne Park Ln
- 2116 Cheyenne Park Ln
- 2112 Estes Park Rd
- 2108 Cheyenne Park Ln
- 2105 Estes Park Rd
- 2108 Estes Park Dr
- 2116 Estes Park Rd
- 2104 Cheyenne Park Ln
- 2104 Estes Park Rd
- 2151 Estes Park Rd
- 2151 Estes Park Dr
- 2120 Cheyenne Ln
- 774 Castle Rock Dr
- 2101 Estes Park Rd
- 2109 Vail Rd
- 716 Castle Rock Dr
- 2113 Vail Rd