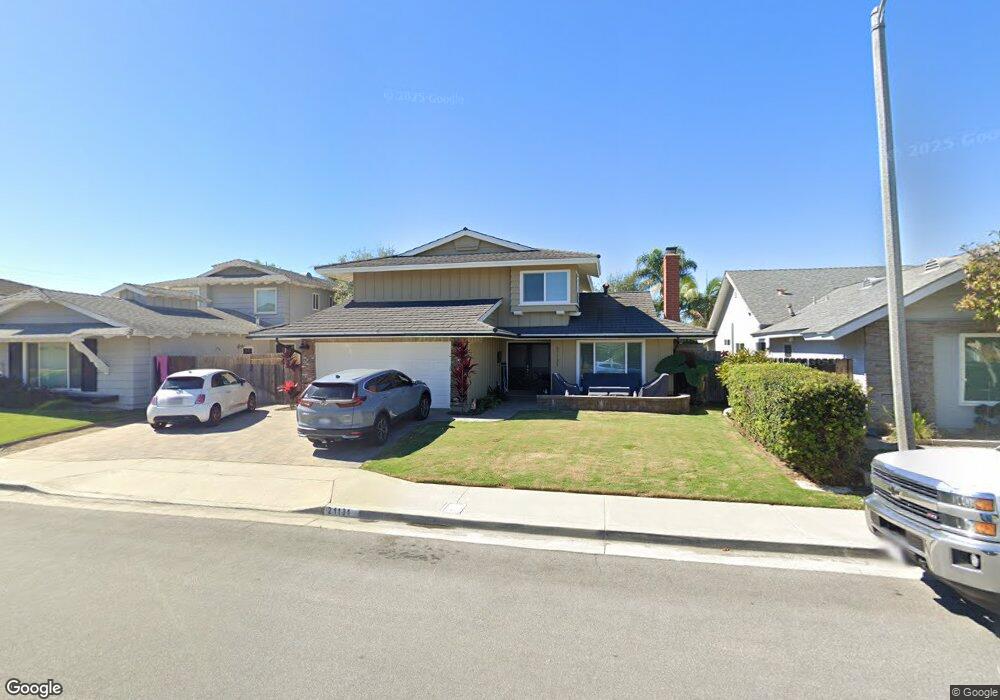
21131 Amberwick Ln Huntington Beach, CA 92646
Southeast NeighborhoodEstimated Value: $1,561,526 - $1,708,000
4
Beds
3
Baths
2,174
Sq Ft
$751/Sq Ft
Est. Value
About This Home
This home is located at 21131 Amberwick Ln, Huntington Beach, CA 92646 and is currently estimated at $1,632,382, approximately $750 per square foot. 21131 Amberwick Ln is a home located in Orange County with nearby schools including John H. Eader Elementary School, Isaac L. Sowers Middle School, and Edison High School.
Ownership History
Date
Name
Owned For
Owner Type
Purchase Details
Closed on
Feb 7, 2025
Sold by
Oconnell John and Oconnell Kristine
Bought by
Oconnell Family Trust and Oconnell
Current Estimated Value
Purchase Details
Closed on
Jun 28, 2001
Sold by
Oconnell John and Oconnell Kristine H
Bought by
Oconnell John and Oconnell Kristine
Home Financials for this Owner
Home Financials are based on the most recent Mortgage that was taken out on this home.
Original Mortgage
$345,600
Interest Rate
7.24%
Purchase Details
Closed on
Mar 28, 2000
Sold by
Wellington Jeffrey R
Bought by
Oconnell John and Oconnell Kristine H
Home Financials for this Owner
Home Financials are based on the most recent Mortgage that was taken out on this home.
Original Mortgage
$308,000
Interest Rate
8.24%
Create a Home Valuation Report for This Property
The Home Valuation Report is an in-depth analysis detailing your home's value as well as a comparison with similar homes in the area
Home Values in the Area
Average Home Value in this Area
Purchase History
| Date | Buyer | Sale Price | Title Company |
|---|---|---|---|
| Oconnell Family Trust | -- | None Listed On Document | |
| Oconnell John | -- | First American Title Ins Co | |
| Oconnell John | $385,000 | Chicago Title Co | |
| Wellington Jeffrey R | -- | Chicago Title Co |
Source: Public Records
Mortgage History
| Date | Status | Borrower | Loan Amount |
|---|---|---|---|
| Previous Owner | Oconnell John | $345,600 | |
| Previous Owner | Oconnell John | $308,000 | |
| Closed | Oconnell John | $38,500 |
Source: Public Records
Tax History Compared to Growth
Tax History
| Year | Tax Paid | Tax Assessment Tax Assessment Total Assessment is a certain percentage of the fair market value that is determined by local assessors to be the total taxable value of land and additions on the property. | Land | Improvement |
|---|---|---|---|---|
| 2025 | $6,711 | $591,731 | $429,167 | $162,564 |
| 2024 | $6,711 | $580,129 | $420,752 | $159,377 |
| 2023 | $6,559 | $568,754 | $412,502 | $156,252 |
| 2022 | $6,385 | $557,602 | $404,413 | $153,189 |
| 2021 | $6,266 | $546,669 | $396,483 | $150,186 |
| 2020 | $6,224 | $541,064 | $392,417 | $148,647 |
| 2019 | $6,150 | $530,455 | $384,722 | $145,733 |
| 2018 | $6,054 | $520,054 | $377,178 | $142,876 |
| 2017 | $5,973 | $509,857 | $369,782 | $140,075 |
| 2016 | $5,709 | $499,860 | $362,531 | $137,329 |
| 2015 | $5,653 | $492,352 | $357,085 | $135,267 |
| 2014 | $5,534 | $482,708 | $350,090 | $132,618 |
Source: Public Records
Map
Nearby Homes
- 9802 Effingham Dr
- 21022 Manessa Cir
- 21072 Galbar Cir
- 9581 Chevy Chase Dr
- 21382 Lemontree Ln
- 21361 Lemontree Ln
- 10101 Theseus Dr
- 2175 Pacific Ave Unit C1
- 20862 Lancelot Ln
- 9812 La Cresta Cir
- 1269 Westreef
- 21662 Brookhurst St Unit D
- 1170 Gleneagles Terrace
- 21221 Hillsdale Ln
- 20392 Redwood Ln
- 20442 Craimer Ln
- 21722 Hilaria Cir
- 21861 Vacation Ln
- 2230 Canyon Dr
- 10172 Stonybrook Dr
- 21141 Amberwick Ln
- 21121 Amberwick Ln
- 21132 Binghampton Cir
- 21142 Binghampton Cir
- 21151 Amberwick Ln
- 21111 Amberwick Ln
- 21122 Binghampton Cir
- 21132 Amberwick Ln
- 21152 Binghampton Cir
- 21142 Amberwick Ln
- 21161 Amberwick Ln
- 21152 Amberwick Ln
- 21112 Amberwick Ln
- 9932 Cornerbrook Dr
- 21162 Binghampton Cir
- 9922 Cornerbrook Dr
- 21111 Binghampton Cir
- 9912 Cornerbrook Dr
- 21162 Amberwick Ln
- 21102 Amberwick Ln