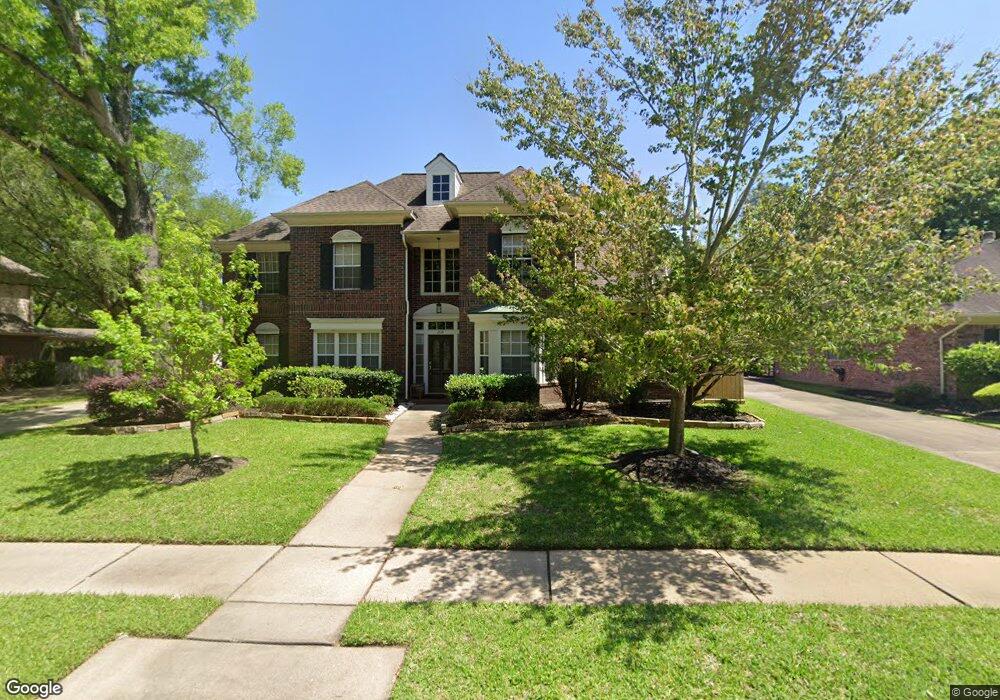
2114 Cherrytree Ridge Ln Houston, TX 77062
Clear Lake NeighborhoodEstimated Value: $447,000 - $525,000
4
Beds
3
Baths
2,846
Sq Ft
$167/Sq Ft
Est. Value
About This Home
This home is located at 2114 Cherrytree Ridge Ln, Houston, TX 77062 and is currently estimated at $474,572, approximately $166 per square foot. 2114 Cherrytree Ridge Ln is a home located in Harris County with nearby schools including Falcon Pass Elementary School, Space Center Intermediate, and Clear Lake High School.
Ownership History
Date
Name
Owned For
Owner Type
Purchase Details
Closed on
Jul 7, 2019
Sold by
Mcmahon Patrick T
Bought by
Robertson Aaron J and Robertson Leslie N
Current Estimated Value
Home Financials for this Owner
Home Financials are based on the most recent Mortgage that was taken out on this home.
Original Mortgage
$296,000
Outstanding Balance
$259,748
Interest Rate
3.9%
Mortgage Type
New Conventional
Estimated Equity
$214,824
Purchase Details
Closed on
Oct 24, 2018
Sold by
Mcmahon Patrick Thomas and Executor Of The Estate Of Vera
Bought by
Mcmahon Patrick Thomas
Purchase Details
Closed on
Dec 15, 2017
Sold by
Saird Gilbert E and Saird Cheryl A
Bought by
Mcmahon Vera J and Mcmahon Patrick T
Home Financials for this Owner
Home Financials are based on the most recent Mortgage that was taken out on this home.
Original Mortgage
$346,655
Interest Rate
3.9%
Mortgage Type
New Conventional
Create a Home Valuation Report for This Property
The Home Valuation Report is an in-depth analysis detailing your home's value as well as a comparison with similar homes in the area
Home Values in the Area
Average Home Value in this Area
Purchase History
| Date | Buyer | Sale Price | Title Company |
|---|---|---|---|
| Robertson Aaron J | -- | Texas American Title Company | |
| Mcmahon Patrick Thomas | -- | None Available | |
| Mcmahon Vera J | -- | Texas American Title Co |
Source: Public Records
Mortgage History
| Date | Status | Borrower | Loan Amount |
|---|---|---|---|
| Open | Robertson Aaron J | $296,000 | |
| Previous Owner | Mcmahon Vera J | $346,655 |
Source: Public Records
Tax History Compared to Growth
Tax History
| Year | Tax Paid | Tax Assessment Tax Assessment Total Assessment is a certain percentage of the fair market value that is determined by local assessors to be the total taxable value of land and additions on the property. | Land | Improvement |
|---|---|---|---|---|
| 2025 | $7,302 | $425,829 | $77,580 | $348,249 |
| 2024 | $7,302 | $408,870 | $77,580 | $331,290 |
| 2023 | $7,302 | $419,955 | $77,580 | $342,375 |
| 2022 | $9,222 | $375,633 | $77,580 | $298,053 |
| 2021 | $8,840 | $343,064 | $77,580 | $265,484 |
| 2020 | $9,632 | $348,408 | $77,580 | $270,828 |
| 2019 | $9,972 | $344,622 | $65,067 | $279,555 |
| 2018 | $1,181 | $320,648 | $60,062 | $260,586 |
| 2017 | $8,489 | $293,591 | $60,062 | $233,529 |
| 2016 | $8,489 | $293,591 | $60,062 | $233,529 |
| 2015 | $6,851 | $290,000 | $60,062 | $229,938 |
| 2014 | $6,851 | $275,000 | $60,062 | $214,938 |
Source: Public Records
Map
Nearby Homes
- 15411 Park Estates Ln
- 15706 Pinewood Cove Dr
- 15307 Montwood Dr
- 1903 Hillside Oak Ln
- 15719 Pinewood Cove Dr
- 15131 Blossom Bay Dr
- 15103 Coral Oak Ct
- 2203 Woodside Dr
- 1922 Winter Knoll Way
- 15914 Meadowside Dr
- 15026 Blossom Bay Dr
- 4519 Amble Oak Ct
- 2010 Woodland Haven Rd
- 15307 Seahorse Dr
- 14919 Redwood Cove Ct
- 15722 Falmouth Dr
- 2034 Park Grand Rd
- 15823 Brook Forest Dr
- 15231 Penn Hills Ln
- 2202 Town Oaks Dr
- 2110 Cherrytree Ridge Ln
- 2118 Cherrytree Ridge Ln
- 2111 Purple Plum Ln
- 2107 Purple Plum Ln
- 2115 Purple Plum Ln
- 2106 Cherrytree Ridge Ln
- 2103 Purple Plum Ln
- 2202 Cherrytree Ridge Ln
- 2102 Cherrytree Ridge Ln
- 2103 Cherrytree Ridge Ln
- 2110 Purple Plum Ln
- 2114 Purple Plum Ln
- 2102 Purple Plum Ln
- 2206 Cherrytree Ridge Ln
- 2106 Purple Plum Ln
- 2207 Purple Plum Ln
- 2023 Aspen River Ln
- 2018 Hillside Oak Ln
- 2022 Hillside Oak Ln
- 2207 Cherrytree Ridge Ln