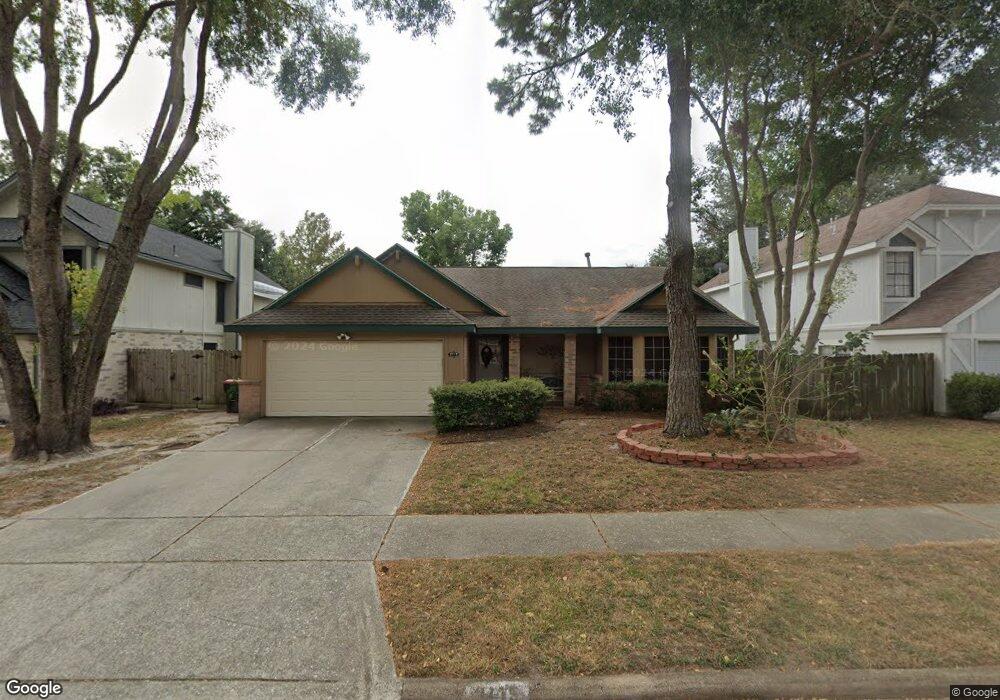
2115 Laurel Bend Ln Houston, TX 77014
Northside NeighborhoodEstimated Value: $230,952 - $242,000
3
Beds
2
Baths
1,727
Sq Ft
$138/Sq Ft
Est. Value
About This Home
This home is located at 2115 Laurel Bend Ln, Houston, TX 77014 and is currently estimated at $237,988, approximately $137 per square foot. 2115 Laurel Bend Ln is a home located in Harris County with nearby schools including Deloras E Thompson Elementary School, Stelle Claughton Middle School, and Andy Dekaney High School.
Ownership History
Date
Name
Owned For
Owner Type
Purchase Details
Closed on
Aug 18, 2000
Sold by
Reyes Mary Gonzales and Reyes Homer
Bought by
Carroll Mary D
Current Estimated Value
Home Financials for this Owner
Home Financials are based on the most recent Mortgage that was taken out on this home.
Original Mortgage
$96,850
Outstanding Balance
$34,943
Interest Rate
8.15%
Mortgage Type
FHA
Estimated Equity
$203,045
Purchase Details
Closed on
Jan 7, 1997
Sold by
Lowe Lori A
Bought by
The First National Bank Of Chicago and American Housing Trust I
Purchase Details
Closed on
Dec 2, 1994
Sold by
Cumento Roberto F and Cumento Josefina P
Bought by
Tschida John M
Home Financials for this Owner
Home Financials are based on the most recent Mortgage that was taken out on this home.
Original Mortgage
$49,400
Interest Rate
8.8%
Mortgage Type
Seller Take Back
Create a Home Valuation Report for This Property
The Home Valuation Report is an in-depth analysis detailing your home's value as well as a comparison with similar homes in the area
Home Values in the Area
Average Home Value in this Area
Purchase History
| Date | Buyer | Sale Price | Title Company |
|---|---|---|---|
| Carroll Mary D | -- | First American Title | |
| The First National Bank Of Chicago | $59,618 | -- | |
| Tschida John M | -- | Stewart Title |
Source: Public Records
Mortgage History
| Date | Status | Borrower | Loan Amount |
|---|---|---|---|
| Open | Carroll Mary D | $96,850 | |
| Previous Owner | Tschida John M | $49,400 | |
| Closed | Tschida John M | $7,775 |
Source: Public Records
Tax History Compared to Growth
Tax History
| Year | Tax Paid | Tax Assessment Tax Assessment Total Assessment is a certain percentage of the fair market value that is determined by local assessors to be the total taxable value of land and additions on the property. | Land | Improvement |
|---|---|---|---|---|
| 2025 | $1,909 | $227,300 | $47,565 | $179,735 |
| 2024 | $1,909 | $227,872 | $47,565 | $180,307 |
| 2023 | $1,909 | $227,872 | $47,565 | $180,307 |
| 2022 | $5,054 | $193,699 | $20,790 | $172,909 |
| 2021 | $4,821 | $158,250 | $20,790 | $137,460 |
| 2020 | $5,123 | $158,250 | $20,790 | $137,460 |
| 2019 | $4,844 | $149,062 | $20,790 | $128,272 |
| 2018 | $1,678 | $130,699 | $20,790 | $109,909 |
| 2017 | $4,182 | $130,699 | $20,790 | $109,909 |
| 2016 | $3,802 | $112,060 | $20,790 | $91,270 |
| 2015 | $3,529 | $112,060 | $20,790 | $91,270 |
| 2014 | $3,529 | $108,064 | $20,790 | $87,274 |
Source: Public Records
Map
Nearby Homes
- 12330 Garden Laurel Ln
- 2230 Laurel Oaks Dr
- 2214 Brimmage Dr
- 2223 Laurel Branch Way
- 12231 Auronia Dr
- 2230 Laurel Branch Way
- 12306 Wright Oaks Dr
- 2411 Prides Crossing Rd
- 12322 Tranquil Pines Dr
- 2423 Prides Crossing Rd
- 12303 Lariat Run Dr
- 12415 Silversmine Dr
- 12606 Riverhill Ct
- 12638 Riverhill Ct
- 1727 Plumwood Dr
- 1675 Hugh Rd Unit C
- 1675 Hugh Rd Unit B
- 12147 Swords Creek Rd
- 12035 Swords Creek Rd
- 12222 Cobbs Creek Rd
- 2111 Laurel Bend Ln
- 2203 Laurel Bend Ln
- 2122 Laurel Land Ln
- 2107 Laurel Bend Ln
- 2207 Laurel Bend Ln
- 2202 Laurel Land Ln
- 2118 Laurel Land Ln
- 2114 Aurel Bend
- 2114 Laurel Bend Ln
- 2206 Laurel Land Ln
- 2114 Laurel Land Ln
- 2202 Laurel Bend Ln
- 2110 Laurel Bend Ln
- 2211 Laurel Bend Ln
- 2103 Laurel Bend Ln
- 2206 Laurel Bend Ln
- 2210 Laurel Land Ln
- 2110 Laurel Land Ln
- 12323 Misty Laurel Dr
- 2214 Laurel Land Ln