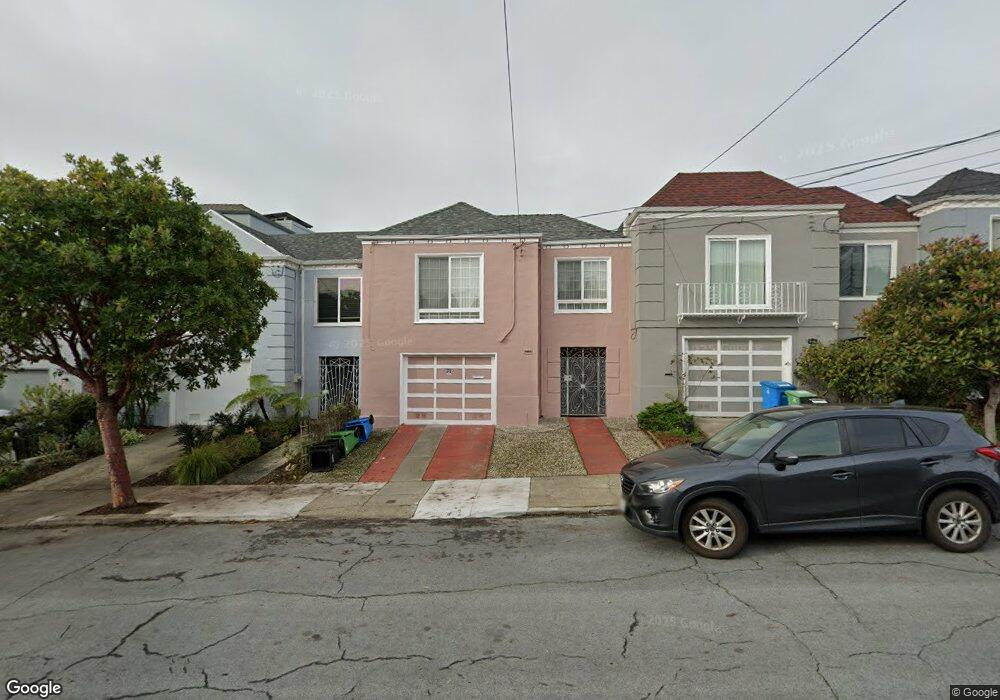
2119 33rd Ave San Francisco, CA 94116
Parkside NeighborhoodEstimated Value: $1,419,000 - $1,797,538
3
Beds
2
Baths
1,956
Sq Ft
$818/Sq Ft
Est. Value
About This Home
This home is located at 2119 33rd Ave, San Francisco, CA 94116 and is currently estimated at $1,599,635, approximately $817 per square foot. 2119 33rd Ave is a home located in San Francisco County with nearby schools including Stevenson (Robert Louis) Elementary School, Giannini (A.P.) Middle School, and St. Gabriel School.
Ownership History
Date
Name
Owned For
Owner Type
Purchase Details
Closed on
Oct 12, 2011
Sold by
Hon Elinna
Bought by
Hon Elinna
Current Estimated Value
Home Financials for this Owner
Home Financials are based on the most recent Mortgage that was taken out on this home.
Original Mortgage
$390,000
Outstanding Balance
$265,353
Interest Rate
4.05%
Mortgage Type
New Conventional
Estimated Equity
$1,334,282
Purchase Details
Closed on
Aug 18, 2009
Sold by
Hon Elinna
Bought by
Hon Elinna
Home Financials for this Owner
Home Financials are based on the most recent Mortgage that was taken out on this home.
Original Mortgage
$417,000
Interest Rate
5.09%
Mortgage Type
New Conventional
Purchase Details
Closed on
Mar 30, 2007
Sold by
Hon Elinna
Bought by
Hon Elinna
Purchase Details
Closed on
Mar 27, 2001
Sold by
Francesconi Claire E
Bought by
Hon Elinna H
Home Financials for this Owner
Home Financials are based on the most recent Mortgage that was taken out on this home.
Original Mortgage
$403,500
Interest Rate
6.75%
Create a Home Valuation Report for This Property
The Home Valuation Report is an in-depth analysis detailing your home's value as well as a comparison with similar homes in the area
Home Values in the Area
Average Home Value in this Area
Purchase History
| Date | Buyer | Sale Price | Title Company |
|---|---|---|---|
| Hon Elinna | -- | Chicago Title Company | |
| Hon Elinna | -- | Chicago Title Company | |
| Hon Elinna | -- | Fidelity National Title Co | |
| Hon Elinna | -- | Fidelity National Title Co | |
| Hon Elinna | -- | None Available | |
| Hon Elinna H | $538,000 | Fidelity National Title Co |
Source: Public Records
Mortgage History
| Date | Status | Borrower | Loan Amount |
|---|---|---|---|
| Open | Hon Elinna | $390,000 | |
| Closed | Hon Elinna | $417,000 | |
| Previous Owner | Hon Elinna H | $403,500 |
Source: Public Records
Tax History Compared to Growth
Tax History
| Year | Tax Paid | Tax Assessment Tax Assessment Total Assessment is a certain percentage of the fair market value that is determined by local assessors to be the total taxable value of land and additions on the property. | Land | Improvement |
|---|---|---|---|---|
| 2025 | $10,468 | $908,931 | $486,402 | $422,529 |
| 2024 | $10,468 | $891,110 | $476,865 | $414,245 |
| 2023 | $10,317 | $873,638 | $467,515 | $406,123 |
| 2022 | $10,133 | $856,510 | $458,349 | $398,161 |
| 2021 | $9,958 | $839,717 | $449,362 | $390,355 |
| 2020 | $9,988 | $831,109 | $444,755 | $386,354 |
| 2019 | $9,644 | $814,815 | $436,035 | $378,780 |
| 2018 | $9,908 | $798,840 | $427,486 | $371,354 |
| 2017 | $9,491 | $783,177 | $419,104 | $364,073 |
| 2016 | $9,324 | $767,822 | $410,887 | $356,935 |
| 2015 | $9,206 | $756,291 | $404,716 | $351,575 |
| 2014 | $8,963 | $741,478 | $396,789 | $344,689 |
Source: Public Records
Map
Nearby Homes