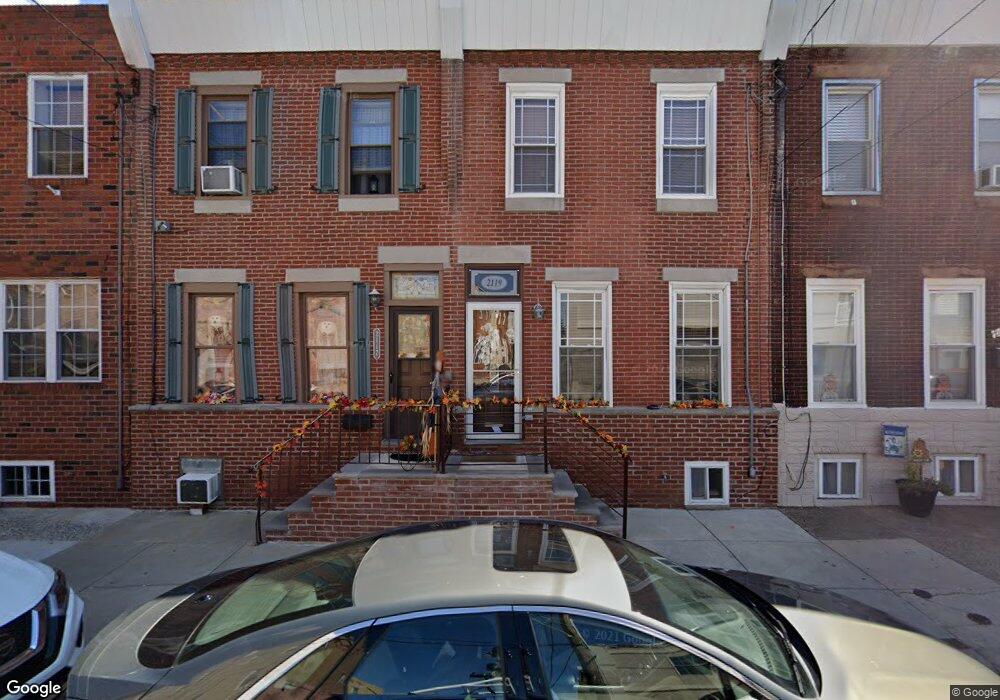
2119 S 3rd St Philadelphia, PA 19148
Whitman NeighborhoodEstimated Value: $281,766 - $323,000
3
Beds
1
Bath
1,212
Sq Ft
$247/Sq Ft
Est. Value
About This Home
This home is located at 2119 S 3rd St, Philadelphia, PA 19148 and is currently estimated at $298,942, approximately $246 per square foot. 2119 S 3rd St is a home located in Philadelphia County with nearby schools including George W. Sharswood School, Furness Horace High School, and St. Casimir School.
Ownership History
Date
Name
Owned For
Owner Type
Purchase Details
Closed on
May 30, 2014
Sold by
Stinsman Charles and The Estate Of Ellen Stinsman
Bought by
Stinsman Charles
Current Estimated Value
Home Financials for this Owner
Home Financials are based on the most recent Mortgage that was taken out on this home.
Original Mortgage
$120,000
Outstanding Balance
$91,188
Interest Rate
4.33%
Mortgage Type
New Conventional
Estimated Equity
$207,754
Purchase Details
Closed on
Jul 20, 2007
Sold by
Cash Construction Inc
Bought by
Stinsman Charles J and Stinsman Ellen
Purchase Details
Closed on
May 18, 2007
Sold by
Milillo Vivian
Bought by
Cash Construction Inc
Purchase Details
Closed on
Mar 30, 1999
Sold by
Milillo Vivian and Estate Of Vivian Adams
Bought by
Milillo Vivian
Purchase Details
Closed on
Jan 28, 1995
Sold by
Adams Vivian
Bought by
Adams Vivian and Milillo Vivian
Create a Home Valuation Report for This Property
The Home Valuation Report is an in-depth analysis detailing your home's value as well as a comparison with similar homes in the area
Home Values in the Area
Average Home Value in this Area
Purchase History
| Date | Buyer | Sale Price | Title Company |
|---|---|---|---|
| Stinsman Charles | $180,000 | None Available | |
| Stinsman Charles J | $135,000 | None Available | |
| Cash Construction Inc | $105,000 | None Available | |
| Milillo Vivian | -- | -- | |
| Adams Vivian | -- | -- |
Source: Public Records
Mortgage History
| Date | Status | Borrower | Loan Amount |
|---|---|---|---|
| Open | Stinsman Charles | $120,000 |
Source: Public Records
Tax History Compared to Growth
Tax History
| Year | Tax Paid | Tax Assessment Tax Assessment Total Assessment is a certain percentage of the fair market value that is determined by local assessors to be the total taxable value of land and additions on the property. | Land | Improvement |
|---|---|---|---|---|
| 2026 | $3,103 | $258,600 | $51,720 | $206,880 |
| 2025 | $3,103 | $258,600 | $51,720 | $206,880 |
| 2024 | $3,103 | $258,600 | $51,720 | $206,880 |
| 2023 | $3,103 | $221,700 | $44,340 | $177,360 |
| 2022 | $1,947 | $176,700 | $44,340 | $132,360 |
| 2021 | $2,577 | $0 | $0 | $0 |
| 2020 | $2,577 | $0 | $0 | $0 |
| 2019 | $2,378 | $0 | $0 | $0 |
| 2018 | $1,982 | $0 | $0 | $0 |
| 2017 | $2,402 | $0 | $0 | $0 |
| 2016 | $1,982 | $0 | $0 | $0 |
| 2015 | $1,855 | $0 | $0 | $0 |
| 2014 | -- | $168,400 | $19,600 | $148,800 |
| 2012 | -- | $11,200 | $2,111 | $9,089 |
Source: Public Records
Map
Nearby Homes
- 2117 S 3rd St
- 2115 S 3rd St
- 2113 S 3rd St
- 2121 S 3rd St
- 2111 S 3rd St
- 2123 S 3rd St
- 2109 S 3rd St
- 2125 S 3rd St
- 2118 S Philip St
- 2120 S Philip St
- 2122 S Philip St
- 2116 S Philip St
- 2114 S Philip St
- 2124 S Philip St
- 2126 S Philip St
- 2107 S 3rd St
- 2127 S 3rd St
- 2112 S Philip St
- 2128 S Philip St
- 2105 S 3rd St