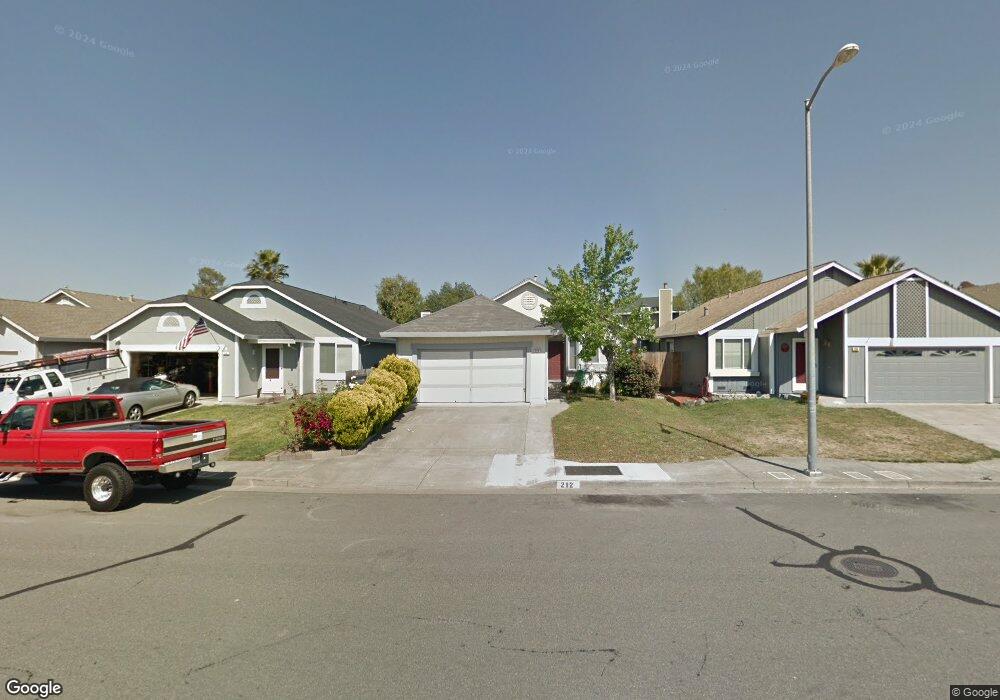
212 Ezra Ave Santa Rosa, CA 95401
Copperfield NeighborhoodEstimated Value: $607,816 - $672,000
3
Beds
2
Baths
1,262
Sq Ft
$505/Sq Ft
Est. Value
About This Home
This home is located at 212 Ezra Ave, Santa Rosa, CA 95401 and is currently estimated at $636,704, approximately $504 per square foot. 212 Ezra Ave is a home located in Sonoma County with nearby schools including J.X. Wilson Elementary School, Elsie Allen High School, and Wright Charter.
Ownership History
Date
Name
Owned For
Owner Type
Purchase Details
Closed on
Aug 8, 2001
Sold by
Almanza Rafael and Vigil Carmen
Bought by
Vigil Carmen and Vigil Claudia
Current Estimated Value
Home Financials for this Owner
Home Financials are based on the most recent Mortgage that was taken out on this home.
Original Mortgage
$195,000
Outstanding Balance
$76,286
Interest Rate
7.19%
Estimated Equity
$560,418
Purchase Details
Closed on
May 31, 1996
Sold by
Vigil Carmen and Vigil Claudia
Bought by
Vigil Carmen and Vigil Claudia
Home Financials for this Owner
Home Financials are based on the most recent Mortgage that was taken out on this home.
Original Mortgage
$157,000
Interest Rate
7.96%
Purchase Details
Closed on
Jul 28, 1994
Sold by
Daza Carlos and Daza Hortensia
Bought by
Vigil Carmen and Vigil Claudia
Home Financials for this Owner
Home Financials are based on the most recent Mortgage that was taken out on this home.
Original Mortgage
$155,500
Interest Rate
8.51%
Create a Home Valuation Report for This Property
The Home Valuation Report is an in-depth analysis detailing your home's value as well as a comparison with similar homes in the area
Home Values in the Area
Average Home Value in this Area
Purchase History
| Date | Buyer | Sale Price | Title Company |
|---|---|---|---|
| Vigil Carmen | $97,500 | Old Republic Title Company | |
| Vigil Carmen | $51,500 | Chicago Title Co | |
| Vigil Carmen | $164,000 | Northwestern Title Company |
Source: Public Records
Mortgage History
| Date | Status | Borrower | Loan Amount |
|---|---|---|---|
| Open | Vigil Carmen | $195,000 | |
| Closed | Vigil Carmen | $157,000 | |
| Closed | Vigil Carmen | $155,500 |
Source: Public Records
Tax History Compared to Growth
Tax History
| Year | Tax Paid | Tax Assessment Tax Assessment Total Assessment is a certain percentage of the fair market value that is determined by local assessors to be the total taxable value of land and additions on the property. | Land | Improvement |
|---|---|---|---|---|
| 2025 | $3,784 | $333,023 | $157,985 | $175,038 |
| 2024 | $3,784 | $326,494 | $154,888 | $171,606 |
| 2023 | $3,784 | $320,093 | $151,851 | $168,242 |
| 2022 | $3,571 | $313,818 | $148,874 | $164,944 |
| 2021 | $3,508 | $307,665 | $145,955 | $161,710 |
| 2020 | $6,518 | $304,511 | $144,459 | $160,052 |
| 2019 | $3,464 | $298,541 | $141,627 | $156,914 |
| 2018 | $3,439 | $292,688 | $138,850 | $153,838 |
| 2017 | $3,369 | $286,950 | $136,128 | $150,822 |
| 2016 | $3,336 | $281,324 | $133,459 | $147,865 |
| 2015 | $3,229 | $277,099 | $131,455 | $145,644 |
| 2014 | $3,109 | $271,672 | $128,880 | $142,792 |
Source: Public Records
Map
Nearby Homes
- 2333 Pacheco Place
- 337 Westmont Place
- 415 Occidental Cir
- 2353 Hood Ct
- 2344 Donahue Ave
- 2315 Cross Ave
- 2305 Cross Ave
- 2400 Valley Dr W
- 307 Occidental Cir
- 314 Michael Dr
- 91 Westgate Cir
- 224 Regency Ct
- 948 Brunello Dr
- 438 Rusty Dr
- 226 Regency Ct
- 213 Monarch Ct
- 2154 Longhorn Cir
- 235 Regency Ct
- 23 Westgate Cir
- 28 Westgate Cir