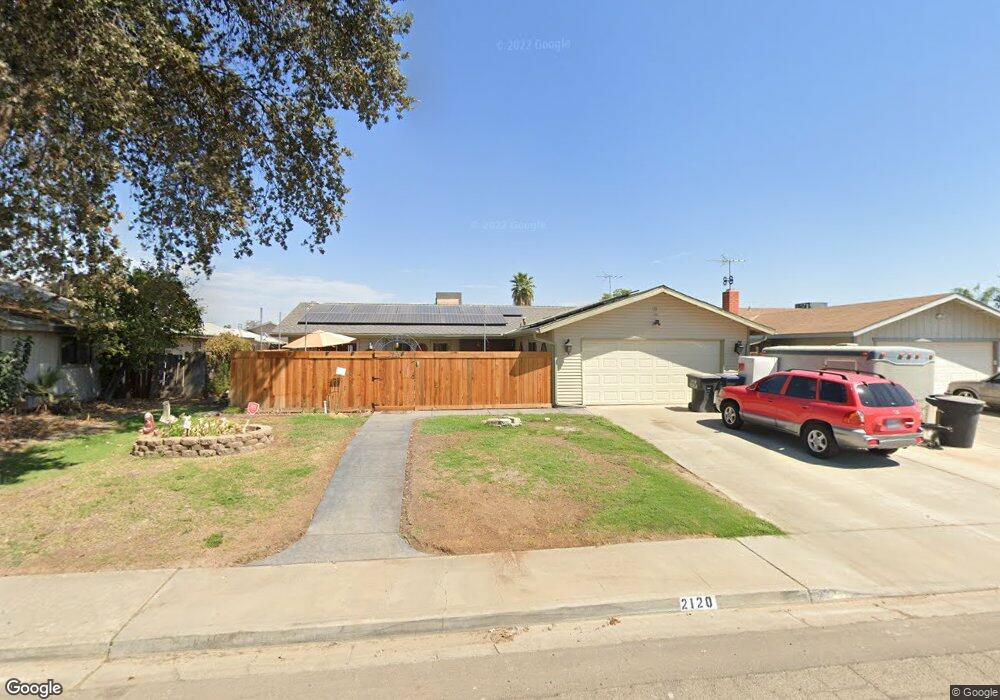
2120 S Maselli St Visalia, CA 93277
Estimated Value: $336,000 - $364,000
3
Beds
2
Baths
1,450
Sq Ft
$243/Sq Ft
Est. Value
About This Home
This home is located at 2120 S Maselli St, Visalia, CA 93277 and is currently estimated at $352,186, approximately $242 per square foot. 2120 S Maselli St is a home located in Tulare County with nearby schools including Linwood Elementary School, La Joya Middle School, and El Diamante High School.
Ownership History
Date
Name
Owned For
Owner Type
Purchase Details
Closed on
Jan 29, 2013
Sold by
Shroyer George W
Bought by
Shroyer George W
Current Estimated Value
Home Financials for this Owner
Home Financials are based on the most recent Mortgage that was taken out on this home.
Original Mortgage
$142,900
Outstanding Balance
$85,754
Interest Rate
3.36%
Mortgage Type
New Conventional
Estimated Equity
$266,432
Purchase Details
Closed on
Feb 27, 2002
Sold by
Michaelian Mark
Bought by
Shroyer George W
Home Financials for this Owner
Home Financials are based on the most recent Mortgage that was taken out on this home.
Original Mortgage
$113,881
Interest Rate
6.99%
Mortgage Type
FHA
Purchase Details
Closed on
Feb 27, 2001
Sold by
Michaelian Mark Marderos
Bought by
Michaelian Mark and Michaelian Debbie
Home Financials for this Owner
Home Financials are based on the most recent Mortgage that was taken out on this home.
Original Mortgage
$87,000
Interest Rate
6.98%
Create a Home Valuation Report for This Property
The Home Valuation Report is an in-depth analysis detailing your home's value as well as a comparison with similar homes in the area
Home Values in the Area
Average Home Value in this Area
Purchase History
| Date | Buyer | Sale Price | Title Company |
|---|---|---|---|
| Shroyer George W | -- | Orange Coast Title Company | |
| Shroyer George W | $115,000 | First American Title Co | |
| Michaelian Mark | -- | Chicago Title Co |
Source: Public Records
Mortgage History
| Date | Status | Borrower | Loan Amount |
|---|---|---|---|
| Open | Shroyer George W | $142,900 | |
| Closed | Shroyer George W | $113,881 | |
| Previous Owner | Michaelian Mark | $87,000 |
Source: Public Records
Tax History Compared to Growth
Tax History
| Year | Tax Paid | Tax Assessment Tax Assessment Total Assessment is a certain percentage of the fair market value that is determined by local assessors to be the total taxable value of land and additions on the property. | Land | Improvement |
|---|---|---|---|---|
| 2025 | $4,357 | $169,747 | $44,321 | $125,426 |
| 2024 | $4,357 | $166,419 | $43,452 | $122,967 |
| 2023 | $4,309 | $163,156 | $42,600 | $120,556 |
| 2022 | $4,256 | $159,958 | $41,765 | $118,193 |
| 2021 | $4,233 | $156,821 | $40,946 | $115,875 |
| 2020 | $4,171 | $155,213 | $40,526 | $114,687 |
| 2019 | $4,128 | $152,169 | $39,731 | $112,438 |
| 2018 | $4,079 | $149,185 | $38,952 | $110,233 |
| 2017 | $4,046 | $146,260 | $38,188 | $108,072 |
| 2016 | $4,014 | $143,392 | $37,439 | $105,953 |
| 2015 | $1,402 | $141,238 | $36,877 | $104,361 |
| 2014 | $1,402 | $138,472 | $36,155 | $102,317 |
Source: Public Records
Map
Nearby Homes
- 5541 W Walnut Ave
- 5730 W Laura Ct
- 5746 W Judy Ct
- 4746 W Ashland Ave
- 2826 S Avocado Ct
- 6028 W Evergreen Ave
- 5505 W Tulare Ave Unit 15
- 5505 W Tulare Ave Unit 24
- 5505 W Tulare Ave Unit 246
- 5505 W Tulare Ave Unit 379
- 5505 W Tulare Ave Unit 64
- 5505 W Tulare Ave Unit 113
- 5505 W Tulare Ave Unit 406
- 5505 W Tulare Ave Unit 378
- 6030 W Country Ct
- 1521 S Jacques St Unit And 55
- 1537 S Jacques St Unit And 53
- 4615 W Feemster Ave
- 4523 W Evergreen Ct
- The Meadowbrook Plan at Wildflower
- 2110 S Maselli St
- 2130 S Maselli St
- 2121 S Akers St
- 2104 S Maselli St
- 2140 S Maselli St
- 2111 S Akers St
- 2131 S Akers St
- 2125 S Maselli St
- 2101 S Akers St
- 5330 W Wagner Ave
- 2100 S Maselli St
- 5418 W Laura Ct
- 5419 W Harter Ave
- 2039 S Akers St
- 5316 W Wagner Ave
- 2205 S Maselli St
- 5400 W Harter Ave
- 5410 W Harter Ave
- 5426 W Laura Ct
- 2029 S Akers St