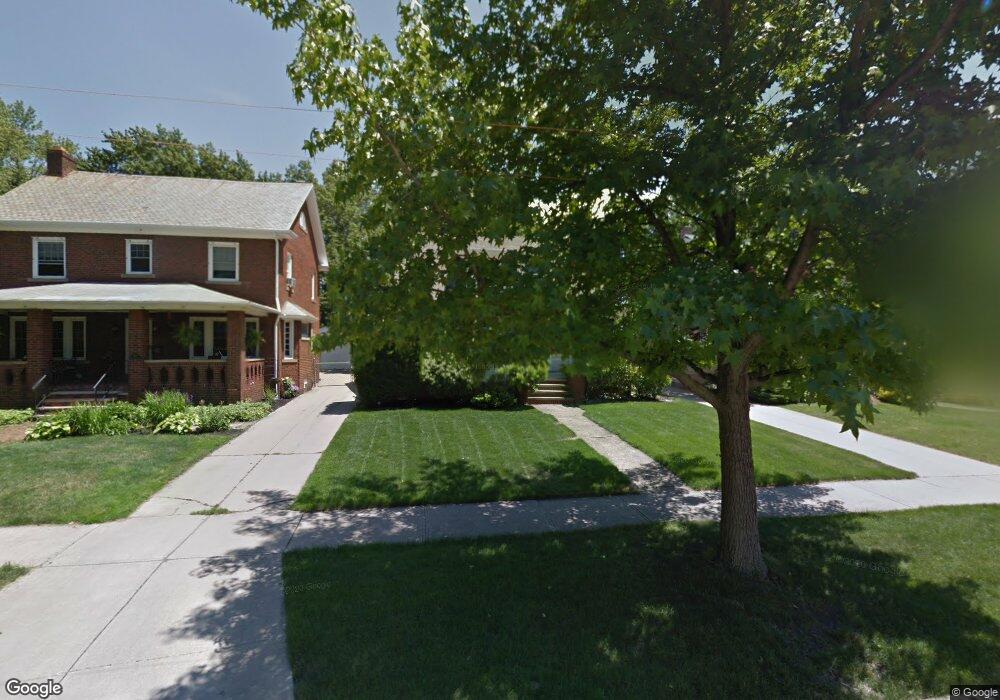
2121 Overbrook Ave Lakewood, OH 44107
Estimated Value: $371,000 - $432,718
4
Beds
2
Baths
2,092
Sq Ft
$194/Sq Ft
Est. Value
About This Home
This home is located at 2121 Overbrook Ave, Lakewood, OH 44107 and is currently estimated at $404,930, approximately $193 per square foot. 2121 Overbrook Ave is a home located in Cuyahoga County with nearby schools including Hayes Elementary School, Harding Middle School, and Lakewood High School.
Ownership History
Date
Name
Owned For
Owner Type
Purchase Details
Closed on
Aug 16, 2018
Sold by
Wentz David J and Wentz Kathleen J
Bought by
Wentz Benjamin S and Wentz Jacob S
Current Estimated Value
Purchase Details
Closed on
May 15, 1996
Sold by
Gentry Charles W
Bought by
Wentz David J and Wentz Kathleen J
Home Financials for this Owner
Home Financials are based on the most recent Mortgage that was taken out on this home.
Original Mortgage
$110,400
Outstanding Balance
$6,210
Interest Rate
7.86%
Mortgage Type
New Conventional
Estimated Equity
$398,720
Purchase Details
Closed on
Jun 5, 1987
Sold by
Consolo Jeffrey P
Bought by
Gentry Charles W
Purchase Details
Closed on
Jul 9, 1982
Sold by
Geiger Patricia K
Bought by
Consolo Jeffrey P
Purchase Details
Closed on
Dec 29, 1975
Sold by
Stevens Raymond H and Stevens Dorothy
Bought by
Geiger Patricia K
Purchase Details
Closed on
Jan 1, 1975
Bought by
Stevens Raymond H and Stevens Dorothy
Create a Home Valuation Report for This Property
The Home Valuation Report is an in-depth analysis detailing your home's value as well as a comparison with similar homes in the area
Home Values in the Area
Average Home Value in this Area
Purchase History
| Date | Buyer | Sale Price | Title Company |
|---|---|---|---|
| Wentz Benjamin S | -- | None Available | |
| Wentz David J | $138,000 | -- | |
| Gentry Charles W | $87,500 | -- | |
| Consolo Jeffrey P | $71,000 | -- | |
| Geiger Patricia K | $40,900 | -- | |
| Stevens Raymond H | -- | -- |
Source: Public Records
Mortgage History
| Date | Status | Borrower | Loan Amount |
|---|---|---|---|
| Open | Wentz David J | $110,400 |
Source: Public Records
Tax History Compared to Growth
Tax History
| Year | Tax Paid | Tax Assessment Tax Assessment Total Assessment is a certain percentage of the fair market value that is determined by local assessors to be the total taxable value of land and additions on the property. | Land | Improvement |
|---|---|---|---|---|
| 2024 | $8,032 | $125,055 | $22,820 | $102,235 |
| 2023 | $7,732 | $103,010 | $22,720 | $80,290 |
| 2022 | $7,781 | $103,010 | $22,720 | $80,290 |
| 2021 | $7,701 | $103,010 | $22,720 | $80,290 |
| 2020 | $6,829 | $79,840 | $17,610 | $62,230 |
| 2019 | $6,558 | $223,500 | $50,300 | $173,200 |
| 2018 | $6,548 | $78,230 | $17,610 | $60,620 |
| 2017 | $6,032 | $65,460 | $14,600 | $50,860 |
| 2016 | $5,990 | $65,460 | $14,600 | $50,860 |
| 2015 | $5,667 | $65,460 | $14,600 | $50,860 |
| 2014 | $5,667 | $59,510 | $13,270 | $46,240 |
Source: Public Records
Map
Nearby Homes
- 2111 Overbrook Ave
- 2192 Glenbury Ave
- 17322 Archdale Ave
- 2223 Eldred Ave
- 2287 Ogontz Ave
- 2209 Woodward Ave
- 2239 Woodward Ave
- 18699 High Pkwy
- 1615 Wagar Ave
- 2234 Olive Ave
- 2099 Olive Ave
- 1464 Riverside Dr
- 1482 Rockway Ave
- 1563 Wagar Ave
- 1422 Gridley St
- 18820 High Pkwy
- 1416 Rio St
- 18904 Mitchell Ave
- 1431 Maile Ave
- 1462 Spring Garden Ave
- 2115 Overbrook Ave
- 2125 Overbrook Ave
- 2129 Overbrook Ave
- 2116 Concord Dr
- 2120 Concord Dr
- 2137 Overbrook Ave
- 2107 Overbrook Ave
- 2124 Concord Dr
- 2110 Concord Dr
- 2106 Concord Dr
- 2141 Overbrook Ave
- 2124 Overbrook Ave
- 2122 Overbrook Ave
- 2128 Concord Dr
- 2126 Overbrook Ave
- 2110 Overbrook Ave
- 2132 Overbrook Ave
- 17705 Riverway Dr
- 17612 Indianola Ave
- 17616 Indianola Ave