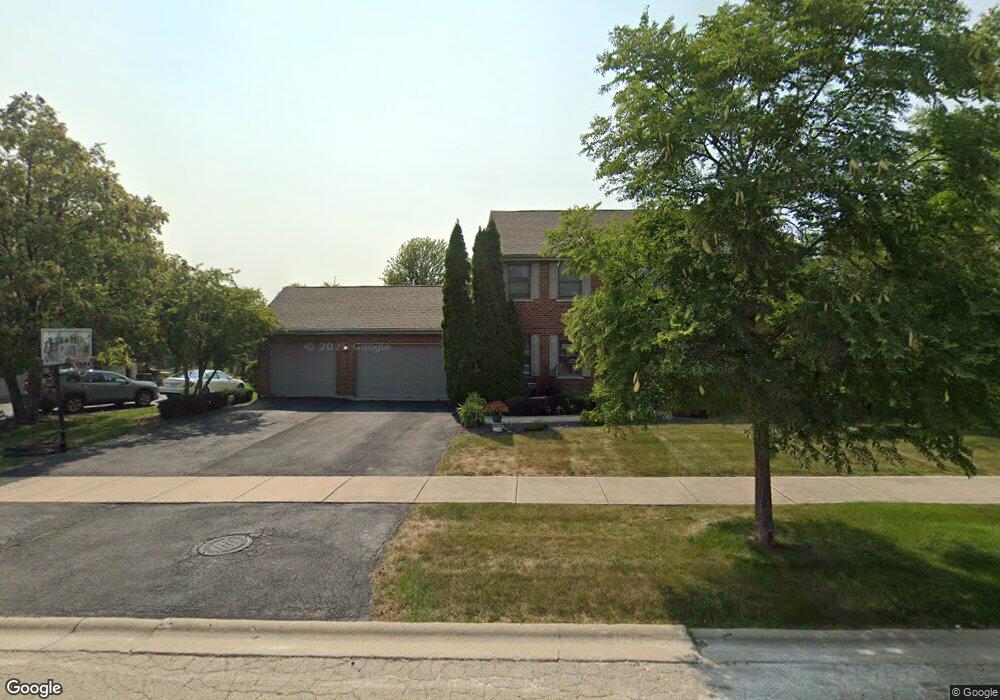
21212 Hunter Woods Dr Frankfort, IL 60423
Frankfort Square NeighborhoodEstimated Value: $458,000 - $532,000
3
Beds
4
Baths
2,286
Sq Ft
$220/Sq Ft
Est. Value
About This Home
This home is located at 21212 Hunter Woods Dr, Frankfort, IL 60423 and is currently estimated at $502,185, approximately $219 per square foot. 21212 Hunter Woods Dr is a home located in Will County with nearby schools including Indian Trail Elementary School, Summit Hill Junior High School, and Lincoln-Way East High School.
Ownership History
Date
Name
Owned For
Owner Type
Purchase Details
Closed on
Nov 6, 2017
Sold by
Eatinger Garret
Bought by
Eatinger Nancy
Current Estimated Value
Home Financials for this Owner
Home Financials are based on the most recent Mortgage that was taken out on this home.
Original Mortgage
$77,005
Interest Rate
4.04%
Mortgage Type
New Conventional
Purchase Details
Closed on
May 15, 1996
Sold by
State Bank Of Countryside
Bought by
Eatinger Garret and Eatinger Nancy
Home Financials for this Owner
Home Financials are based on the most recent Mortgage that was taken out on this home.
Original Mortgage
$91,500
Interest Rate
7.99%
Purchase Details
Closed on
Aug 10, 1994
Sold by
Boles Brian C
Bought by
State Bank Of Countryside
Home Financials for this Owner
Home Financials are based on the most recent Mortgage that was taken out on this home.
Original Mortgage
$140,000
Interest Rate
8.73%
Mortgage Type
Construction
Purchase Details
Closed on
Mar 25, 1994
Sold by
Standard Bank & Trust Company
Bought by
Boles Brian
Create a Home Valuation Report for This Property
The Home Valuation Report is an in-depth analysis detailing your home's value as well as a comparison with similar homes in the area
Home Values in the Area
Average Home Value in this Area
Purchase History
| Date | Buyer | Sale Price | Title Company |
|---|---|---|---|
| Eatinger Nancy | $75,000 | Attorney | |
| Eatinger Garret | $207,500 | -- | |
| State Bank Of Countryside | -- | Chicago Title Insurance Co | |
| Boles Brian | $57,000 | Intercounty Title |
Source: Public Records
Mortgage History
| Date | Status | Borrower | Loan Amount |
|---|---|---|---|
| Previous Owner | Eatinger Nancy | $77,005 | |
| Previous Owner | Eatinger Garret | $91,500 | |
| Previous Owner | State Bank Of Countryside | $140,000 |
Source: Public Records
Tax History Compared to Growth
Tax History
| Year | Tax Paid | Tax Assessment Tax Assessment Total Assessment is a certain percentage of the fair market value that is determined by local assessors to be the total taxable value of land and additions on the property. | Land | Improvement |
|---|---|---|---|---|
| 2024 | $13,178 | $158,908 | $36,443 | $122,465 |
| 2023 | $13,178 | $141,920 | $32,547 | $109,373 |
| 2022 | $11,657 | $129,265 | $29,645 | $99,620 |
| 2021 | $10,946 | $120,933 | $27,734 | $93,199 |
| 2020 | $10,776 | $117,524 | $26,952 | $90,572 |
| 2019 | $10,421 | $114,379 | $26,231 | $88,148 |
| 2018 | $10,045 | $111,091 | $25,477 | $85,614 |
| 2017 | $9,834 | $108,498 | $24,882 | $83,616 |
| 2016 | $9,532 | $104,778 | $24,029 | $80,749 |
| 2015 | $9,191 | $101,088 | $23,183 | $77,905 |
| 2014 | $9,191 | $100,385 | $23,022 | $77,363 |
| 2013 | $9,191 | $101,686 | $23,320 | $78,366 |
Source: Public Records
Map
Nearby Homes
- 21257 S 79th Ave
- 7626 W Hickory Creek Dr
- 21122 S Hillside Rd
- 7324 Heritage Ct Unit 2D
- 7319 Colony Ln Unit 1G
- 7223 W Mathews Dr
- 9999 Aberdeen Rd
- 20552 S Frankfort Square Rd
- 515 Durham Dr
- 20513 S Acorn Ridge Dr
- 7639 W Juniper Ct
- 7723 Jamison Dr
- 8631 Saddlebred Ct Unit 75
- 590 Timber Ln
- 8638 Saddlebred Ct Unit 24
- 20347 S Grand Prairie Ln
- 8667 Saddlebred Ct Unit 10-3
- 8643 Shire Ct
- 21437 Breton Rd
- 21466 English Cir
- 21204 Hunter Woods Dr
- 21220 Hunter Woods Dr
- 7746 Steeple Chase Dr
- 7752 Steeple Chase Dr
- 21211 Hunter Woods Dr
- 21228 Hunter Woods Dr
- 21156 Hunter Woods Dr
- 7735 Coventry Ln
- 21219 Hunter Woods Dr
- 21203 Hunter Woods Dr
- 7742 Steeple Chase Dr
- 7745 Coventry Ln
- 21227 Hunter Woods Dr
- 21155 Hunter Woods Dr
- 7758 Steeple Chase Dr
- 7690 Brittany Ct
- 7690 Steeple Chase Dr
- 7677 Brittany Ct
- 21147 Hunter Woods Dr
- 7757 Coventry Ln