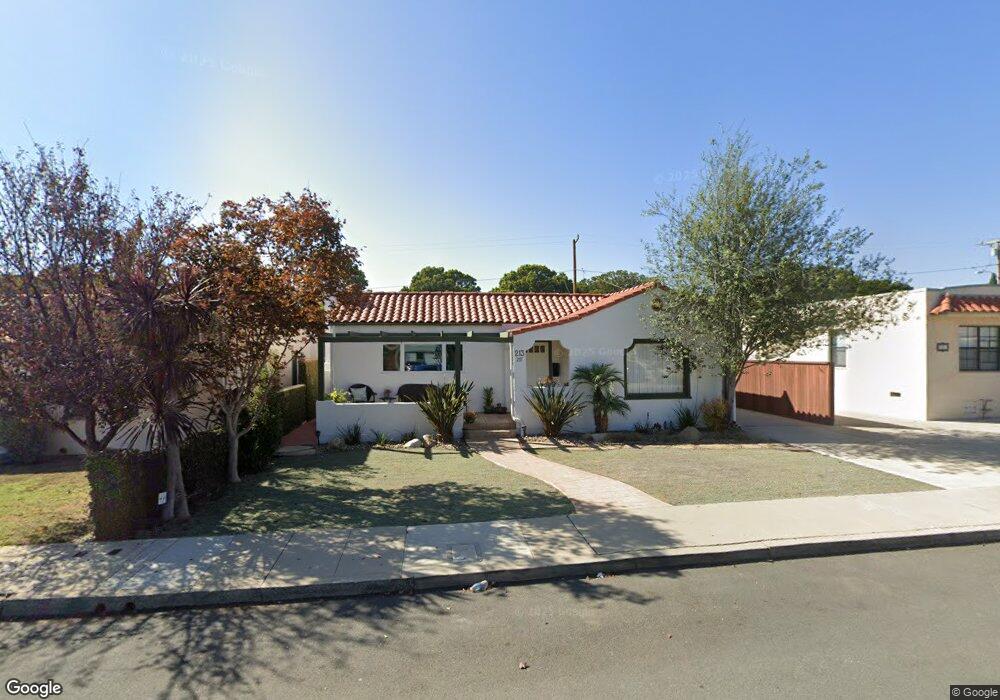
213 Dalton St Ventura, CA 93003
Midtown NeighborhoodEstimated Value: $1,097,374 - $1,451,000
3
Beds
2
Baths
1,767
Sq Ft
$716/Sq Ft
Est. Value
About This Home
This home is located at 213 Dalton St, Ventura, CA 93003 and is currently estimated at $1,265,594, approximately $716 per square foot. 213 Dalton St is a home located in Ventura County with nearby schools including Loma Vista Elementary School, Cabrillo Middle School, and Ventura High School.
Ownership History
Date
Name
Owned For
Owner Type
Purchase Details
Closed on
Mar 4, 2008
Sold by
Calire Mario
Bought by
Calire Mario and Calire Carissa M
Current Estimated Value
Home Financials for this Owner
Home Financials are based on the most recent Mortgage that was taken out on this home.
Original Mortgage
$240,000
Interest Rate
4.85%
Mortgage Type
New Conventional
Purchase Details
Closed on
Oct 8, 1999
Sold by
Helm Keith B and Helm Melissa K
Bought by
Calire Mario
Home Financials for this Owner
Home Financials are based on the most recent Mortgage that was taken out on this home.
Original Mortgage
$216,000
Interest Rate
7.82%
Purchase Details
Closed on
Aug 10, 1998
Sold by
Richard Kreuz
Bought by
Helm Keith Brian and Helm Melissa Kay
Home Financials for this Owner
Home Financials are based on the most recent Mortgage that was taken out on this home.
Original Mortgage
$219,200
Interest Rate
6.88%
Create a Home Valuation Report for This Property
The Home Valuation Report is an in-depth analysis detailing your home's value as well as a comparison with similar homes in the area
Home Values in the Area
Average Home Value in this Area
Purchase History
| Date | Buyer | Sale Price | Title Company |
|---|---|---|---|
| Calire Mario | -- | Chicago Title Company | |
| Calire Mario | $316,000 | Lawyers Title Company | |
| Helm Keith Brian | $274,000 | Chicago Title Co |
Source: Public Records
Mortgage History
| Date | Status | Borrower | Loan Amount |
|---|---|---|---|
| Closed | Calire Mario | $240,000 | |
| Previous Owner | Calire Mario | $216,000 | |
| Previous Owner | Helm Keith Brian | $219,200 | |
| Closed | Helm Keith Brian | $27,400 |
Source: Public Records
Tax History Compared to Growth
Tax History
| Year | Tax Paid | Tax Assessment Tax Assessment Total Assessment is a certain percentage of the fair market value that is determined by local assessors to be the total taxable value of land and additions on the property. | Land | Improvement |
|---|---|---|---|---|
| 2025 | $5,219 | $485,655 | $322,752 | $162,903 |
| 2024 | $5,219 | $476,133 | $316,424 | $159,709 |
| 2023 | $5,155 | $466,798 | $310,220 | $156,578 |
| 2022 | $4,801 | $457,646 | $304,138 | $153,508 |
| 2021 | $4,708 | $448,673 | $298,174 | $150,499 |
| 2020 | $4,662 | $444,073 | $295,117 | $148,956 |
| 2019 | $4,575 | $435,367 | $289,331 | $146,036 |
| 2018 | $4,498 | $426,831 | $283,658 | $143,173 |
| 2017 | $4,403 | $418,463 | $278,097 | $140,366 |
| 2016 | $4,316 | $410,259 | $272,645 | $137,614 |
| 2015 | $4,269 | $404,098 | $268,550 | $135,548 |
| 2014 | $4,199 | $396,185 | $263,291 | $132,894 |
Source: Public Records
Map
Nearby Homes
- 2542 Poli St
- 2418 Lexington Dr
- 69 S Seaward Ave
- 220 Frances St
- 344 S Evergreen Dr
- 297 Rancho Dr
- Plan D at Portalvo - Townhomes
- Plan F at Portalvo - Townhomes
- Plan E at Portalvo - Townhomes
- Plan O at Portalvo - Condos/Flats
- Plan A at Portalvo - Townhomes
- Plan H at Portalvo - Condos/Flats
- Plan L at Portalvo - Condos/Flats
- Plan C at Portalvo - Townhomes
- Plan B at Portalvo - Townhomes
- Plan J at Portalvo - Condos/Flats
- Plan G at Portalvo - Townhomes
- Plan N at Portalvo - Condos/Flats
- Plan K at Portalvo - Condos/Flats
- Plan M at Portalvo - Condos/Flats