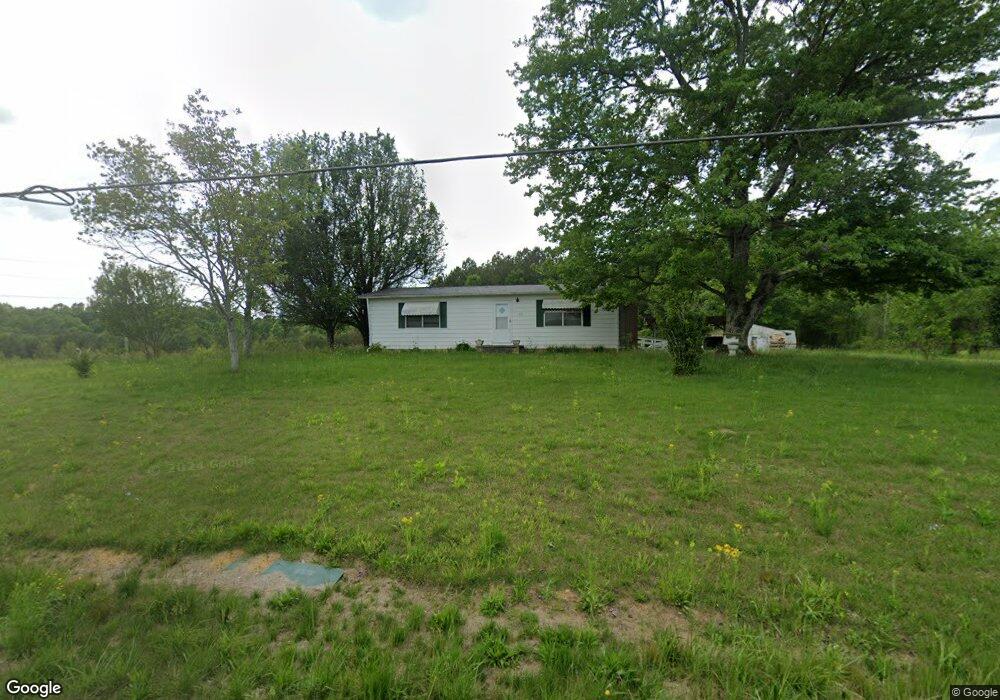
213 Mull Rd Benton, TN 37307
Estimated Value: $144,429 - $243,000
--
Bed
2
Baths
1,008
Sq Ft
$199/Sq Ft
Est. Value
About This Home
This home is located at 213 Mull Rd, Benton, TN 37307 and is currently estimated at $200,357, approximately $198 per square foot. 213 Mull Rd is a home located in Polk County.
Ownership History
Date
Name
Owned For
Owner Type
Purchase Details
Closed on
Oct 14, 2025
Sold by
Freeman Catherine L
Bought by
Wilson Dennis and Wilson Cynthia R
Current Estimated Value
Home Financials for this Owner
Home Financials are based on the most recent Mortgage that was taken out on this home.
Original Mortgage
$245,000
Outstanding Balance
$245,000
Interest Rate
6.5%
Mortgage Type
Construction
Estimated Equity
-$44,643
Purchase Details
Closed on
Oct 11, 2000
Sold by
Shaka Kusaiadi
Bought by
Aisha Gilliam G
Purchase Details
Closed on
Apr 22, 1999
Sold by
Ryan Helton
Bought by
Kimberly Thomas
Purchase Details
Closed on
Feb 11, 1999
Sold by
Logan and Arike Kusaidi Arike
Bought by
Daryl Martin
Purchase Details
Closed on
Mar 20, 1997
Sold by
Logan and Arike Kusaidi Arike
Bought by
Muse Joyce E
Purchase Details
Closed on
Nov 14, 1995
Sold by
Logan and Arike Kusaidi Arike
Bought by
John Branch
Purchase Details
Closed on
Jan 29, 1982
Bought by
Freeman Catherine L
Create a Home Valuation Report for This Property
The Home Valuation Report is an in-depth analysis detailing your home's value as well as a comparison with similar homes in the area
Home Values in the Area
Average Home Value in this Area
Purchase History
| Date | Buyer | Sale Price | Title Company |
|---|---|---|---|
| Wilson Dennis | $126,000 | Hiwassee Valley Title Llc | |
| Aisha Gilliam G | $30,000 | -- | |
| Kimberly Thomas | $33,820 | -- | |
| Daryl Martin | $27,000 | -- | |
| Ryan Helton | $10,000 | -- | |
| Muse Joyce E | $44,280 | -- | |
| John Branch | $12,000 | -- | |
| Freeman Catherine L | -- | -- |
Source: Public Records
Mortgage History
| Date | Status | Borrower | Loan Amount |
|---|---|---|---|
| Open | Wilson Dennis | $245,000 |
Source: Public Records
Tax History Compared to Growth
Tax History
| Year | Tax Paid | Tax Assessment Tax Assessment Total Assessment is a certain percentage of the fair market value that is determined by local assessors to be the total taxable value of land and additions on the property. | Land | Improvement |
|---|---|---|---|---|
| 2024 | $387 | $22,925 | $6,725 | $16,200 |
| 2023 | $387 | $22,925 | $0 | $0 |
| 2022 | $402 | $16,000 | $6,050 | $9,950 |
| 2021 | $402 | $16,000 | $6,050 | $9,950 |
| 2020 | $402 | $16,000 | $6,050 | $9,950 |
| 2019 | $402 | $16,000 | $6,050 | $9,950 |
| 2018 | $402 | $16,000 | $6,050 | $9,950 |
| 2017 | $417 | $16,525 | $6,050 | $10,475 |
| 2016 | $397 | $16,525 | $6,050 | $10,475 |
| 2015 | $397 | $16,525 | $6,050 | $10,475 |
| 2014 | $397 | $16,527 | $0 | $0 |
Source: Public Records
Map
Nearby Homes
- 326 Benton Station Rd
- 352 Benton Station Rd
- Lot 18 Crews Dr
- 18 Crews Dr
- 1137 Lot 3 Reynolds Bridge Rd
- 1137 Lot 2 Reynolds Bridge Rd
- 0 Ocoee River Landing Dr Unit 20252171
- 125 Mila Mae Ln
- 156 Mila Mae Ln
- 1140 Reynolds Bridge Rd
- 1728 Chestuee Rd NE
- Lot 14 Gatlin Rd
- 600 Gatlin Rd NE
- 000 Chestuee Dr NE
- 1020 Thomas Rd
- 110 Dakota Dr NE
- Lot #1 Dakota Ln NE
- Lot 1 Dakota Ln NE
- 509 Chestuee Rd NE
- 311 Old York Rd