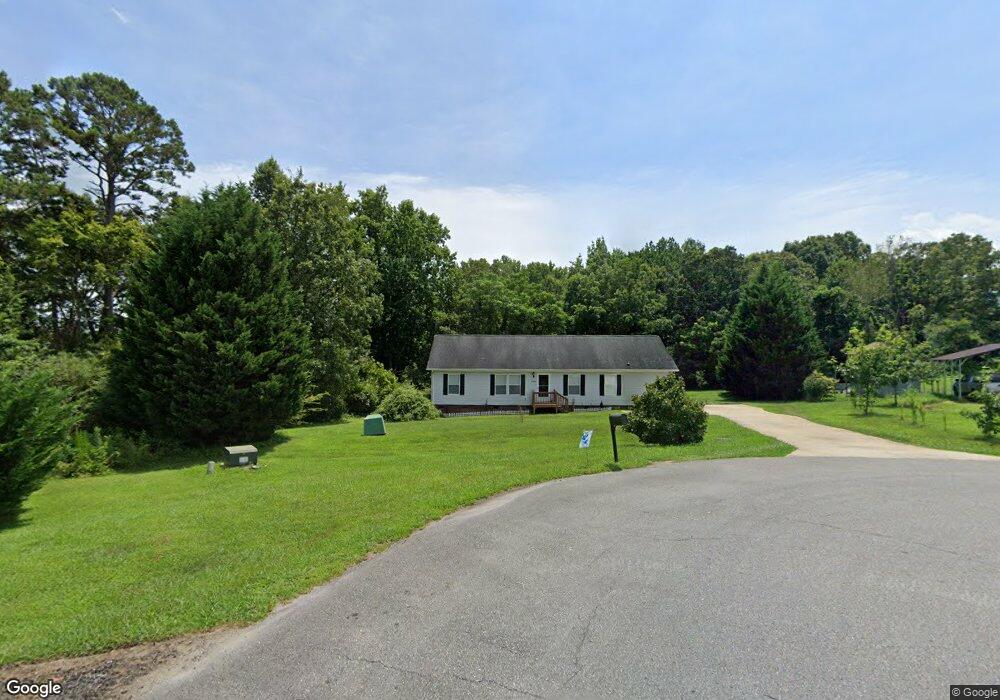
2130 Blueprint Ct Crouse, NC 28033
Estimated Value: $164,000 - $341,000
3
Beds
2
Baths
1,680
Sq Ft
$148/Sq Ft
Est. Value
About This Home
This home is located at 2130 Blueprint Ct, Crouse, NC 28033 and is currently estimated at $248,333, approximately $147 per square foot. 2130 Blueprint Ct is a home located in Gaston County with nearby schools including Cherryville Elementary School, William B. Beam Intermediate School, and John Chavis Middle School.
Ownership History
Date
Name
Owned For
Owner Type
Purchase Details
Closed on
Feb 25, 2015
Sold by
Lutz C Dean and Lutz Ginger V
Bought by
Brown Christopher F and Brown Lora Radford
Current Estimated Value
Home Financials for this Owner
Home Financials are based on the most recent Mortgage that was taken out on this home.
Original Mortgage
$95,714
Outstanding Balance
$73,496
Interest Rate
3.75%
Mortgage Type
New Conventional
Estimated Equity
$174,837
Purchase Details
Closed on
Aug 13, 2014
Sold by
Chestine Matthew and Chestine Paula
Bought by
Dean Lutz & Sain Properties Llc
Purchase Details
Closed on
Oct 22, 2004
Sold by
Cook Charles R and Cook Judith B
Bought by
Chestine Matthew and Chestine Paula
Home Financials for this Owner
Home Financials are based on the most recent Mortgage that was taken out on this home.
Original Mortgage
$112,000
Interest Rate
5.73%
Mortgage Type
Purchase Money Mortgage
Create a Home Valuation Report for This Property
The Home Valuation Report is an in-depth analysis detailing your home's value as well as a comparison with similar homes in the area
Home Values in the Area
Average Home Value in this Area
Purchase History
| Date | Buyer | Sale Price | Title Company |
|---|---|---|---|
| Brown Christopher F | $90,500 | None Available | |
| Dean Lutz & Sain Properties Llc | $29,908 | None Available | |
| Chestine Matthew | $18,000 | -- |
Source: Public Records
Mortgage History
| Date | Status | Borrower | Loan Amount |
|---|---|---|---|
| Open | Brown Christopher F | $95,714 | |
| Previous Owner | Chestine Matthew | $112,000 |
Source: Public Records
Tax History Compared to Growth
Tax History
| Year | Tax Paid | Tax Assessment Tax Assessment Total Assessment is a certain percentage of the fair market value that is determined by local assessors to be the total taxable value of land and additions on the property. | Land | Improvement |
|---|---|---|---|---|
| 2025 | $1,991 | $278,840 | $18,000 | $260,840 |
| 2024 | $1,991 | $278,840 | $18,000 | $260,840 |
| 2023 | $1,938 | $278,840 | $18,000 | $260,840 |
| 2022 | $1,347 | $146,450 | $13,500 | $132,950 |
| 2021 | $1,325 | $146,450 | $13,500 | $132,950 |
| 2019 | $1,331 | $146,450 | $13,500 | $132,950 |
| 2018 | $1,222 | $127,806 | $15,600 | $112,206 |
| 2017 | $1,206 | $127,806 | $15,600 | $112,206 |
| 2016 | $1,206 | $127,806 | $0 | $0 |
| 2014 | $1,238 | $131,142 | $22,500 | $108,642 |
Source: Public Records
Map
Nearby Homes
- 253 Suncrest Rd
- 215 Suncrest Rd
- 0000 Dallas Cherryville Hwy
- 240 Hephzibah Church Rd
- 805 Hephzibah Church Rd
- 000 Lawrence Rd
- 130 Inglebrook Ln
- 102 Aderholdt Rd
- 2724 Lincolnton Hwy
- 101 Greenway Ave
- 00 N Carolina 150
- 2121 Hephzibah Church Rd
- 0000B Dallas Cherryville Hwy
- 547 Saint Marks Church Rd
- 129 Williams Rd
- 5219 Doe Meadow Ct
- 4050 Muirfield Dr
- 00 Muirfield Dr
- 01 Muirfield Dr
- 211 Forgotten Ln
- 2126 Blueprint Ct
- 2133 Blueprint Ct
- 2118 Blueprint Ct
- 2114 Blueprint Ct
- 2111 Blueprint Ct
- 2110 Blueprint Ct
- 554 Charlie Carpenter Trail
- 2028 S Carpenter Square Rd SE Unit 22
- 2012 Carpenters Square Rd
- 2008 Carpenters Square Rd
- 2036 Carpenters Square Rd
- 2025 Carpenter Square Rd
- 165 Otto Rd
- 2040 Carpenters Square Rd
- 2033 Carpenter Square Rd
- 2037 Carpenter Square Rd
- 2044 Carpenter Square Rd
- 2009 Carpenters Square Rd
- 1203 Saint Marks Church Rd
- 1238 Saint Marks Church Rd