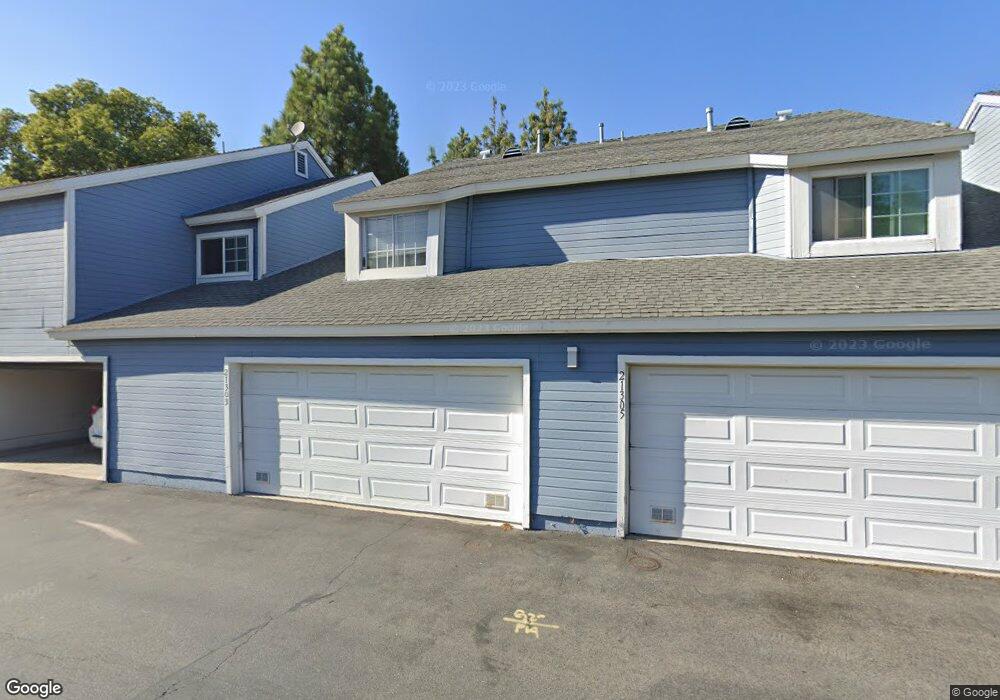
21303 Cottonwood Ln Walnut, CA 91789
Estimated Value: $622,500 - $781,000
2
Beds
2
Baths
1,280
Sq Ft
$550/Sq Ft
Est. Value
About This Home
This home is located at 21303 Cottonwood Ln, Walnut, CA 91789 and is currently estimated at $704,625, approximately $550 per square foot. 21303 Cottonwood Ln is a home located in Los Angeles County with nearby schools including Walnut Elementary School, South Pointe Middle School, and Walnut High School.
Ownership History
Date
Name
Owned For
Owner Type
Purchase Details
Closed on
Oct 15, 2019
Sold by
Chung Wing Hay
Bought by
Chung Wing Hay and The Wing Hay Chung Revocable T
Current Estimated Value
Purchase Details
Closed on
Oct 7, 2014
Sold by
Chung Wing Hay
Bought by
Chung Wing Hay
Home Financials for this Owner
Home Financials are based on the most recent Mortgage that was taken out on this home.
Original Mortgage
$607,500
Outstanding Balance
$465,394
Interest Rate
4.08%
Mortgage Type
Reverse Mortgage Home Equity Conversion Mortgage
Estimated Equity
$239,231
Purchase Details
Closed on
Jun 3, 1999
Sold by
Chung Andy
Bought by
Chung Peter W
Home Financials for this Owner
Home Financials are based on the most recent Mortgage that was taken out on this home.
Original Mortgage
$106,400
Interest Rate
6.9%
Purchase Details
Closed on
Jan 21, 1997
Sold by
Wilhelm Marianne R
Bought by
Chung Andy and Kao Chin Ying
Purchase Details
Closed on
Mar 23, 1994
Sold by
Blood Philip F
Bought by
Wilhelm Marianne R
Create a Home Valuation Report for This Property
The Home Valuation Report is an in-depth analysis detailing your home's value as well as a comparison with similar homes in the area
Home Values in the Area
Average Home Value in this Area
Purchase History
| Date | Buyer | Sale Price | Title Company |
|---|---|---|---|
| Chung Wing Hay | -- | None Available | |
| Chung Wing Hay | -- | Lawyers Title Company | |
| Chung Peter W | $133,000 | Fidelity Title | |
| Chung Andy | $115,000 | Old Republic Title Company | |
| Wilhelm Marianne R | -- | -- |
Source: Public Records
Mortgage History
| Date | Status | Borrower | Loan Amount |
|---|---|---|---|
| Open | Chung Wing Hay | $607,500 | |
| Closed | Chung Peter W | $106,400 |
Source: Public Records
Tax History Compared to Growth
Tax History
| Year | Tax Paid | Tax Assessment Tax Assessment Total Assessment is a certain percentage of the fair market value that is determined by local assessors to be the total taxable value of land and additions on the property. | Land | Improvement |
|---|---|---|---|---|
| 2025 | $2,788 | $208,479 | $123,210 | $85,269 |
| 2024 | $2,788 | $204,393 | $120,795 | $83,598 |
| 2023 | $2,724 | $200,386 | $118,427 | $81,959 |
| 2022 | $2,663 | $196,457 | $116,105 | $80,352 |
| 2021 | $2,607 | $192,606 | $113,829 | $78,777 |
| 2019 | $2,521 | $186,895 | $110,453 | $76,442 |
| 2018 | $2,422 | $183,232 | $108,288 | $74,944 |
| 2016 | $2,242 | $176,119 | $104,084 | $72,035 |
| 2015 | $2,251 | $173,474 | $102,521 | $70,953 |
| 2014 | -- | $170,077 | $100,513 | $69,564 |
Source: Public Records
Map
Nearby Homes
- 21269 Cottonwood Ln
- 21217 E Washington Unit 136
- 733 Lincoln Ave
- 838 Windwood Dr
- 20869 Moonlake St
- 20739 Lycoming St Unit 112
- 20824 Fuero Dr
- 22499 Birds Eye Dr
- 424 S Lemon Ave
- 883 Terrace Ln W Unit 1
- 1569 Silver Ln
- 1721 Cliffbranch Dr
- 22749 Lakeway Dr Unit 377
- 22749 Lakeway Dr Unit 375
- 1714 Roundtree Cir
- 22733 Lakeway Dr Unit 356
- 22700 Lakeway Dr Unit 331
- 421 Wrangler Way
- 22809 Hilton Head Dr Unit 5
- 22809 Hilton Head Dr Unit 8
- 21301 Cottonwood Ln
- 21305 Cottonwood Ln
- 21307 Cottonwood Ln
- 21281 Cottonwood Ln
- 21279 Cottonwood Ln
- 21277 Cottonwood Ln
- 21275 Cottonwood Ln
- 21309 Cottonwood Ln
- 21311 Cottonwood Ln
- 21315 Cottonwood Ln
- 21273 Cottonwood Ln
- 21317 Cottonwood Ln
- 21271 Cottonwood Ln
- 21319 Cottonwood Ln
- 21321 Cottonwood Ln
- 21259 Cottonwood Ln
- 21261 Cottonwood Ln
- 21263 Cottonwood Ln
- 21265 Cottonwood Ln
- 21267 Cottonwood Ln