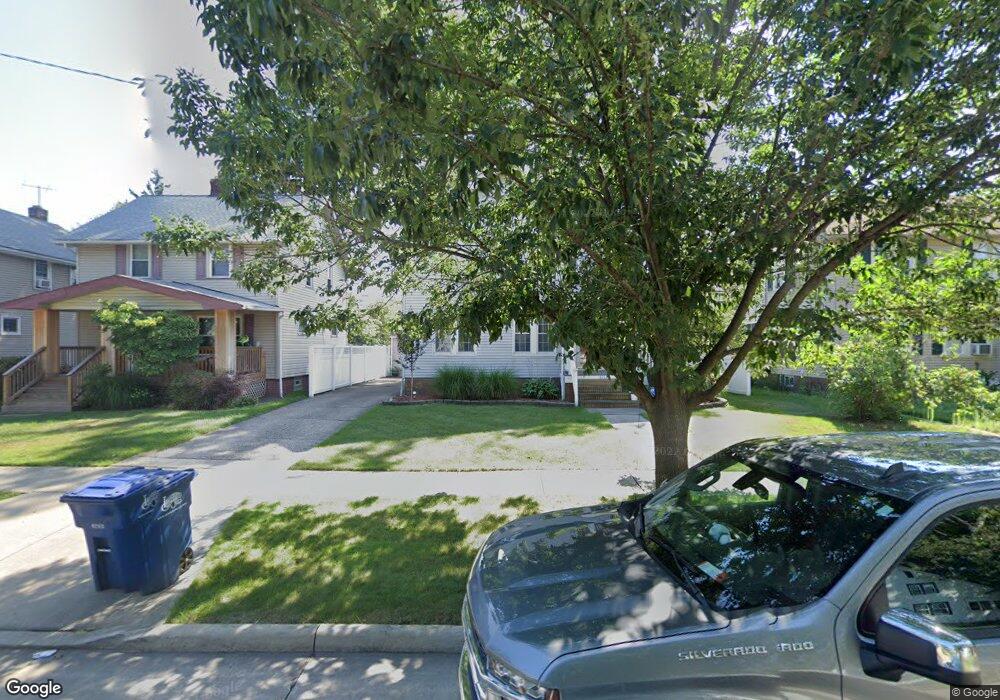
2131 Belle Ave Lakewood, OH 44107
Estimated Value: $277,000 - $336,000
3
Beds
2
Baths
1,248
Sq Ft
$253/Sq Ft
Est. Value
About This Home
This home is located at 2131 Belle Ave, Lakewood, OH 44107 and is currently estimated at $315,804, approximately $253 per square foot. 2131 Belle Ave is a home located in Cuyahoga County with nearby schools including Hayes Elementary School, Harding Middle School, and Lakewood High School.
Ownership History
Date
Name
Owned For
Owner Type
Purchase Details
Closed on
Nov 17, 1998
Sold by
Negray Michael J and Negray Beth A
Bought by
Gillespie Joyce A
Current Estimated Value
Home Financials for this Owner
Home Financials are based on the most recent Mortgage that was taken out on this home.
Original Mortgage
$102,600
Outstanding Balance
$22,395
Interest Rate
6.59%
Estimated Equity
$293,409
Purchase Details
Closed on
Oct 18, 1993
Sold by
Nash Gerald A
Bought by
Negray Michael J
Purchase Details
Closed on
Aug 5, 1991
Sold by
Nash Ronald Herman Exc
Bought by
Nash Gerald A
Purchase Details
Closed on
Jan 15, 1991
Sold by
Pesta Donald
Bought by
Nash Ronald Herman Exc
Purchase Details
Closed on
Apr 18, 1980
Sold by
Pesta Donald J
Bought by
Pesta Donald
Purchase Details
Closed on
Jan 1, 1975
Bought by
Pesta Donald J
Create a Home Valuation Report for This Property
The Home Valuation Report is an in-depth analysis detailing your home's value as well as a comparison with similar homes in the area
Home Values in the Area
Average Home Value in this Area
Purchase History
| Date | Buyer | Sale Price | Title Company |
|---|---|---|---|
| Gillespie Joyce A | $108,000 | Guardian Title | |
| Negray Michael J | $86,000 | -- | |
| Nash Gerald A | $40,000 | -- | |
| Nash Ronald Herman Exc | $55,500 | -- | |
| Pesta Donald | -- | -- | |
| Pesta Donald J | -- | -- |
Source: Public Records
Mortgage History
| Date | Status | Borrower | Loan Amount |
|---|---|---|---|
| Open | Gillespie Joyce A | $102,600 |
Source: Public Records
Tax History Compared to Growth
Tax History
| Year | Tax Paid | Tax Assessment Tax Assessment Total Assessment is a certain percentage of the fair market value that is determined by local assessors to be the total taxable value of land and additions on the property. | Land | Improvement |
|---|---|---|---|---|
| 2024 | $5,649 | $87,955 | $18,130 | $69,825 |
| 2023 | $5,010 | $66,750 | $13,970 | $52,780 |
| 2022 | $5,042 | $66,750 | $13,970 | $52,780 |
| 2021 | $4,990 | $66,750 | $13,970 | $52,780 |
| 2020 | $4,425 | $51,730 | $10,820 | $40,920 |
| 2019 | $4,338 | $147,800 | $30,900 | $116,900 |
| 2018 | $4,183 | $51,730 | $10,820 | $40,920 |
| 2017 | $4,064 | $44,100 | $8,750 | $35,350 |
| 2016 | $4,036 | $44,100 | $8,750 | $35,350 |
| 2015 | $4,040 | $44,100 | $8,750 | $35,350 |
| 2014 | $4,040 | $42,420 | $8,400 | $34,020 |
Source: Public Records
Map
Nearby Homes
- 14428 Delaware Ave
- 14404 Bayes Ave
- 2263 Warren Rd
- 2209 Alger Rd
- 14909 Arden Ave
- 2078 Baxterly Ave
- 14924 Arden Ave
- 14926 Esther Ave
- 2230 Alger Rd
- 14924 Delaware Ave
- 2165 Arthur Ave
- 14031 Lakewood Heights Blvd
- 1675 Roosevelt Ave
- 2203 Bunts Rd
- 2233 Bunts Rd
- 2100 Wascana Ave
- 1669 Robinwood Ave
- 14104 Hazelmere Ave
- 14426 Alger Rd
- 1593 Marlowe Ave
- 2127 Belle Ave
- 2135 Belle Ave
- 14530 Bayes Ave
- 2123 Belle Ave
- 14524 Bayes Ave
- 2119 Belle Ave
- 14520 Bayes Ave
- 14600 Bayes Ave
- 2130 Belle Ave
- 14516 Bayes Ave
- 14517 Athens Ave
- 2126 Belle Ave
- 2113 Belle Ave
- 2122 Belle Ave
- 14513 Athens Ave
- 14512 Bayes Ave
- 14610 Bayes Ave
- 2118 Belle Ave
- 14533 Bayes Ave
- 14537 Bayes Ave