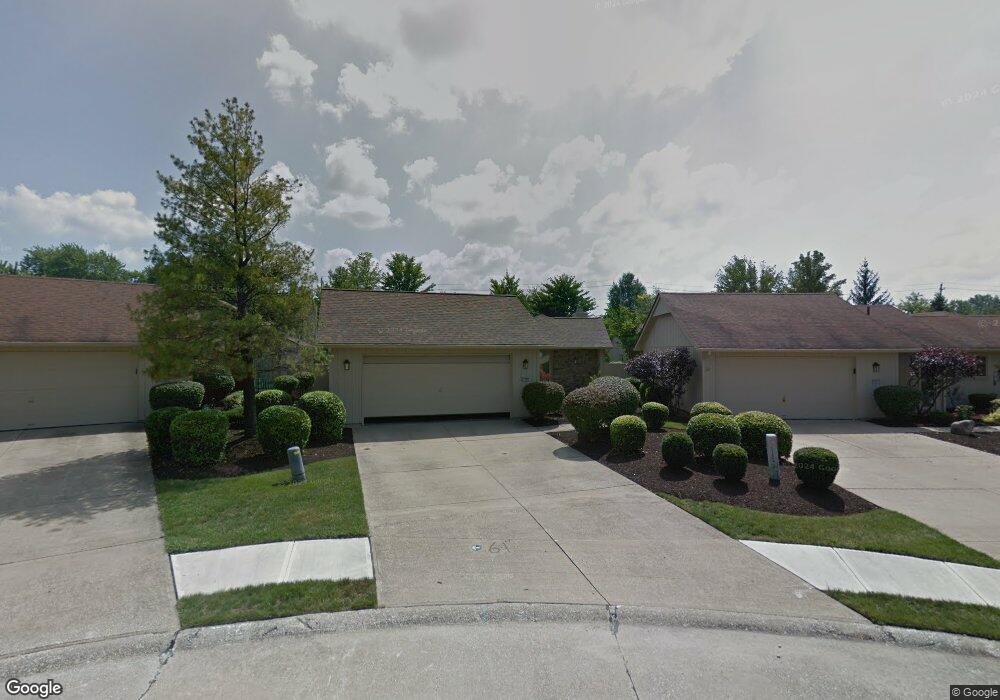
21383 Oak Bark Trail Strongsville, OH 44149
Estimated Value: $360,041 - $409,000
2
Beds
3
Baths
2,209
Sq Ft
$173/Sq Ft
Est. Value
About This Home
This home is located at 21383 Oak Bark Trail, Strongsville, OH 44149 and is currently estimated at $382,010, approximately $172 per square foot. 21383 Oak Bark Trail is a home located in Cuyahoga County with nearby schools including Strongsville High School and Sts Joseph & John Interparochial School.
Ownership History
Date
Name
Owned For
Owner Type
Purchase Details
Closed on
Sep 17, 2000
Sold by
Keco George D and Keco Julianne T
Bought by
Keco Julianne T
Current Estimated Value
Purchase Details
Closed on
Apr 26, 1999
Sold by
Krug Ronald A and Krug Martha J
Bought by
Keco George D and Keco Julianne T
Home Financials for this Owner
Home Financials are based on the most recent Mortgage that was taken out on this home.
Original Mortgage
$140,000
Outstanding Balance
$36,203
Interest Rate
7.05%
Estimated Equity
$345,807
Purchase Details
Closed on
Oct 2, 1996
Sold by
Demarco Laura
Bought by
Krug Ronald A and Krug Martha J
Home Financials for this Owner
Home Financials are based on the most recent Mortgage that was taken out on this home.
Original Mortgage
$138,000
Interest Rate
8%
Mortgage Type
New Conventional
Purchase Details
Closed on
Jun 15, 1989
Bought by
Demarco Laura L
Purchase Details
Closed on
Jan 1, 1988
Bought by
Bob Schmitt Homes Inc
Create a Home Valuation Report for This Property
The Home Valuation Report is an in-depth analysis detailing your home's value as well as a comparison with similar homes in the area
Home Values in the Area
Average Home Value in this Area
Purchase History
| Date | Buyer | Sale Price | Title Company |
|---|---|---|---|
| Keco Julianne T | -- | -- | |
| Keco George D | $201,000 | Midland Title Security Inc | |
| Krug Ronald A | $188,600 | -- | |
| Demarco Laura L | $151,900 | -- | |
| Bob Schmitt Homes Inc | -- | -- |
Source: Public Records
Mortgage History
| Date | Status | Borrower | Loan Amount |
|---|---|---|---|
| Open | Keco George D | $140,000 | |
| Closed | Krug Ronald A | $138,000 |
Source: Public Records
Tax History Compared to Growth
Tax History
| Year | Tax Paid | Tax Assessment Tax Assessment Total Assessment is a certain percentage of the fair market value that is determined by local assessors to be the total taxable value of land and additions on the property. | Land | Improvement |
|---|---|---|---|---|
| 2024 | $4,899 | $114,135 | $17,010 | $97,125 |
| 2023 | $5,255 | $93,100 | $16,170 | $76,930 |
| 2022 | $5,243 | $93,100 | $16,170 | $76,930 |
| 2021 | $5,202 | $93,100 | $16,170 | $76,930 |
| 2020 | $4,712 | $76,340 | $13,270 | $63,070 |
| 2019 | $4,573 | $218,100 | $37,900 | $180,200 |
| 2018 | $4,131 | $76,340 | $13,270 | $63,070 |
| 2017 | $4,189 | $71,890 | $10,290 | $61,600 |
| 2016 | $4,155 | $71,890 | $10,290 | $61,600 |
| 2015 | $4,074 | $71,890 | $10,290 | $61,600 |
| 2014 | $4,074 | $69,800 | $9,980 | $59,820 |
Source: Public Records
Map
Nearby Homes
- 21355 Hickory Branch Trail
- 21176 Hickory Branch Trail
- 10839 Prospect Rd
- 10353 Oak Branch Trail
- 20684 Albion Rd
- 0 Priem Rd
- 11030 Southwind Ct
- 10842 Fence Row Dr
- 22300 Rock Creek Cir
- 20424 Scotch Pine Way
- 9829 Plum Brook Ln
- 10824 Watercress Rd
- 10830 Gate Post Rd
- 20050 Idlewood Trail
- 19997 Idlewood Trail
- 10800 Meadow Trail
- 9598 Pebble Brook Ln
- 12579 Woodberry Ln
- 19890 Idlewood Trail
- 22235 North Trail
- 21411 Oak Bark Trail
- 21355 Oak Bark Trail
- 21327 Oak Bark Trail
- 21439 Oak Bark Trail
- 21300 Oak Bark Trail
- 21467 Oak Bark Trail
- 21388 Oak Bark Trail
- 21366 Oak Bark Trail
- 21344 Oak Bark Trail
- 21322 Oak Bark Trail
- 21410 Oak Bark Trail
- 21483 Oak Bark Trail
- 21432 Oak Bark Trail
- 21454 Oak Bark Trail
- 21348 Timber Oak Ct
- 21378 Timber Oak Ct
- 21398 Timber Oak Ct
- 21298 Albion Rd
- 21476 Oak Bark Trail
- 21523 Oak Bark Trail