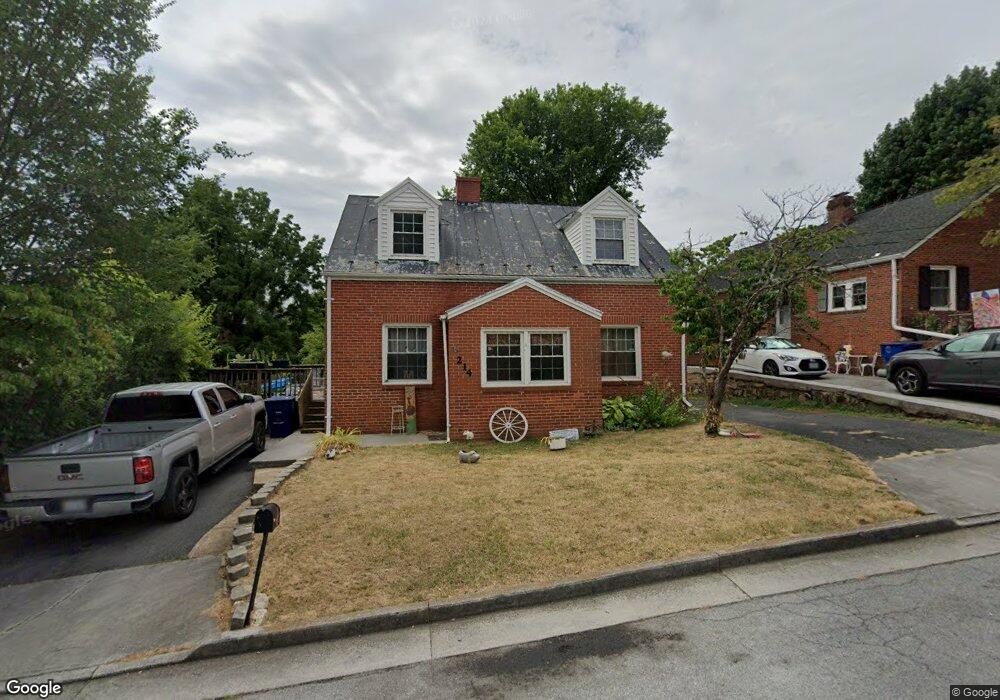
214 W 8th St Front Royal, VA 22630
Estimated Value: $382,368
4
Beds
2
Baths
1,191
Sq Ft
$321/Sq Ft
Est. Value
About This Home
This home is located at 214 W 8th St, Front Royal, VA 22630 and is currently estimated at $382,368, approximately $321 per square foot. 214 W 8th St is a home located in Warren County with nearby schools including E. Wilson Morrison Elementary School, Skyline High School, and Mountain Laurel Montessori School.
Ownership History
Date
Name
Owned For
Owner Type
Purchase Details
Closed on
Mar 26, 2012
Sold by
Williams Christopher R and Williams Christopher
Bought by
Wrc Rentals Llc
Current Estimated Value
Home Financials for this Owner
Home Financials are based on the most recent Mortgage that was taken out on this home.
Original Mortgage
$210,000
Outstanding Balance
$145,323
Interest Rate
3.95%
Mortgage Type
Credit Line Revolving
Estimated Equity
$237,045
Purchase Details
Closed on
May 25, 2010
Sold by
Jones Jason and Clatterbuck Tiffany
Bought by
Secretary Of Hud
Purchase Details
Closed on
Jan 15, 2008
Sold by
Lane David A
Bought by
Jones Jason and Clatterbuck Tiffany
Home Financials for this Owner
Home Financials are based on the most recent Mortgage that was taken out on this home.
Original Mortgage
$196,910
Interest Rate
6.02%
Mortgage Type
FHA
Create a Home Valuation Report for This Property
The Home Valuation Report is an in-depth analysis detailing your home's value as well as a comparison with similar homes in the area
Home Values in the Area
Average Home Value in this Area
Purchase History
| Date | Buyer | Sale Price | Title Company |
|---|---|---|---|
| Wrc Rentals Llc | -- | None Available | |
| Secretary Of Hud | $215,438 | -- | |
| Jones Jason | $200,000 | -- |
Source: Public Records
Mortgage History
| Date | Status | Borrower | Loan Amount |
|---|---|---|---|
| Open | Wrc Rentals Llc | $210,000 | |
| Previous Owner | Jones Jason | $196,910 |
Source: Public Records
Tax History Compared to Growth
Tax History
| Year | Tax Paid | Tax Assessment Tax Assessment Total Assessment is a certain percentage of the fair market value that is determined by local assessors to be the total taxable value of land and additions on the property. | Land | Improvement |
|---|---|---|---|---|
| 2025 | $1,304 | $272,300 | $40,300 | $232,000 |
| 2024 | $1,155 | $217,900 | $40,300 | $177,600 |
| 2023 | $1,068 | $217,900 | $40,300 | $177,600 |
| 2022 | $967 | $147,600 | $35,000 | $112,600 |
| 2021 | $192 | $147,600 | $35,000 | $112,600 |
| 2020 | $967 | $147,600 | $35,000 | $112,600 |
| 2019 | $967 | $147,600 | $35,000 | $112,600 |
| 2018 | $869 | $131,600 | $35,000 | $96,600 |
| 2017 | $855 | $131,600 | $35,000 | $96,600 |
| 2016 | $816 | $131,600 | $35,000 | $96,600 |
| 2015 | -- | $131,600 | $35,000 | $96,600 |
| 2014 | -- | $117,500 | $35,000 | $82,500 |
Source: Public Records
Map
Nearby Homes
- 812 Virginia Ave
- 0 Kendrick Ln
- 303 W 10th St
- 0 Warren Ave Unit VAWR2004930
- 0 Warren Ave Unit VAWR2004946
- 518 Warren Ave
- 330 W 11th St
- 1101 N Royal Ave
- 368 W 9th St
- 1216 Commonwealth Ave
- 710 New Ave
- 113 W 1st St
- 617 New Ave
- 6 Massie St
- 308 W Main St
- 425 W 15th St
- 404 Viscose Ave
- 0 E 14th St
- 0 Orchard St
- 656 W 11th St