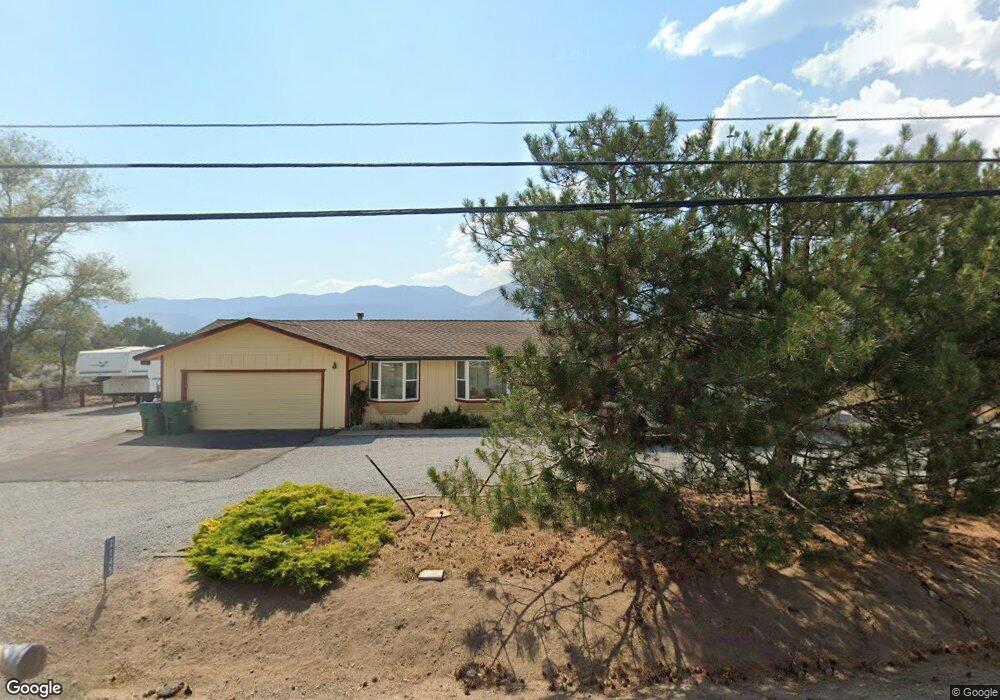
2145 Lake Shore Dr Washoe Valley, NV 89704
New Washoe City NeighborhoodEstimated Value: $582,205 - $696,000
3
Beds
2
Baths
1,808
Sq Ft
$350/Sq Ft
Est. Value
About This Home
This home is located at 2145 Lake Shore Dr, Washoe Valley, NV 89704 and is currently estimated at $632,051, approximately $349 per square foot. 2145 Lake Shore Dr is a home located in Washoe County with nearby schools including Pleasant Valley Elementary School, Marce Herz Middle School, and Galena High School.
Ownership History
Date
Name
Owned For
Owner Type
Purchase Details
Closed on
Jan 11, 2024
Sold by
Fralick Fredrick M and Fralick Donna R
Bought by
Fredrick & Donna Redmond Fralick Revocable Tr and Fralick
Current Estimated Value
Create a Home Valuation Report for This Property
The Home Valuation Report is an in-depth analysis detailing your home's value as well as a comparison with similar homes in the area
Home Values in the Area
Average Home Value in this Area
Purchase History
| Date | Buyer | Sale Price | Title Company |
|---|---|---|---|
| Fredrick & Donna Redmond Fralick Revocable Tr | -- | None Listed On Document |
Source: Public Records
Tax History Compared to Growth
Tax History
| Year | Tax Paid | Tax Assessment Tax Assessment Total Assessment is a certain percentage of the fair market value that is determined by local assessors to be the total taxable value of land and additions on the property. | Land | Improvement |
|---|---|---|---|---|
| 2025 | $1,982 | $89,808 | $52,500 | $37,308 |
| 2024 | $1,982 | $85,748 | $47,250 | $38,498 |
| 2023 | $1,924 | $79,139 | $42,000 | $37,139 |
| 2022 | $1,868 | $66,490 | $35,000 | $31,490 |
| 2021 | $1,814 | $58,088 | $26,250 | $31,838 |
| 2020 | $1,761 | $57,891 | $25,550 | $32,341 |
| 2019 | $1,710 | $56,277 | $24,500 | $31,777 |
| 2018 | $1,660 | $56,045 | $24,500 | $31,545 |
| 2017 | $1,612 | $56,172 | $24,150 | $32,022 |
| 2016 | $1,571 | $54,191 | $21,000 | $33,191 |
| 2015 | $1,533 | $47,884 | $15,750 | $32,134 |
| 2014 | $1,489 | $45,948 | $14,700 | $31,248 |
| 2013 | -- | $45,814 | $14,700 | $31,114 |
Source: Public Records
Map
Nearby Homes
- 55 Darilyn Ln
- 2475 Brenda Way
- 1740 Slide View Cir
- 2450 Chukar Dr
- 1555 Eastlake Blvd
- 3460 Pershing Ln
- 3612 White Pine Dr
- 390 Flicker Cir
- 1211 Skinner Dr
- 4340 Jumbo Grade Way
- 0 Bryan Canyon Rd Unit 240002394
- 665 Old Ophir Rd
- 1140 Eastlake Blvd
- 330 Sanctuary Way
- 390 Old Washoe Cir
- 3180 Makayla
- 325 Old Washoe Cir
- 300 Old Washoe Cir
- 1015 U S 395
- APN 05017035
- 2135 Lake Shore Dr
- 2110 Lake Shore Dr
- 2155 Lake Shore Dr
- 2160 Lake Shore Dr
- 2060 Lake Shore Dr
- 4720 Giles Way
- 2165 Lake Shore Dr
- 2110 Beaver Dr
- 2010 Lake Shore Dr
- 2190 Lake Shore Dr
- 4741 Giles Way
- 1995 Lake Shore Dr
- 2085 Rabbit Dr
- 4730 Giles Way
- 2035 Rabbit Dr
- 2120 Beaver Dr
- 2065 Rabbit Dr
- 2095 Rabbit Dr
- 2230 Lake Shore Dr
- 2235 Lake Shore Dr