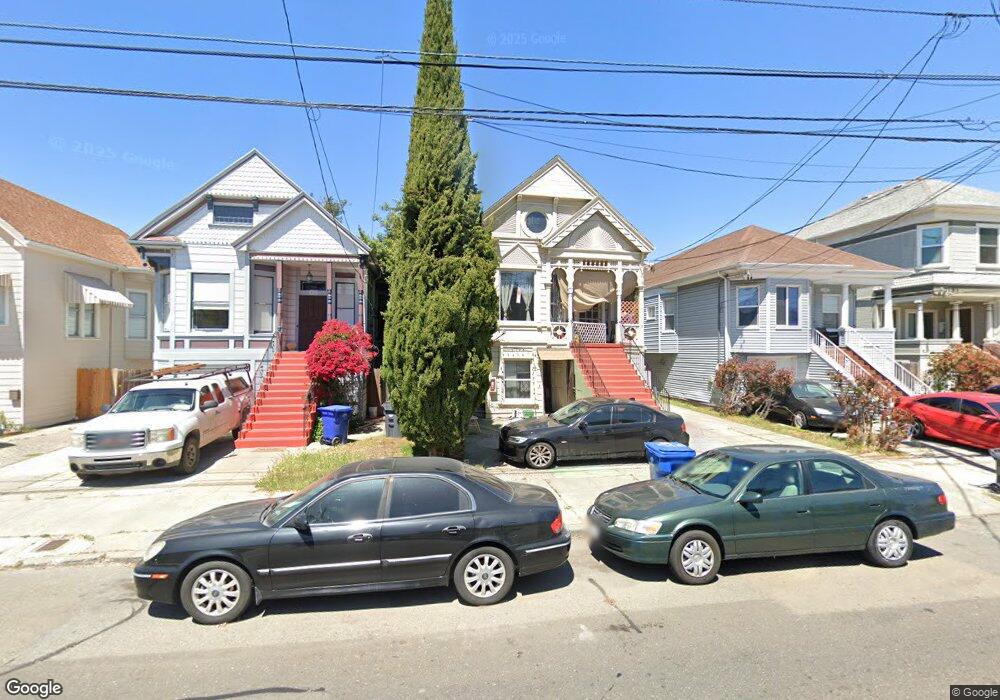
2145 Lincoln Ave Alameda, CA 94501
Downtown Alameda NeighborhoodEstimated Value: $1,117,000 - $1,754,094
7
Beds
4
Baths
2,920
Sq Ft
$487/Sq Ft
Est. Value
About This Home
This home is located at 2145 Lincoln Ave, Alameda, CA 94501 and is currently estimated at $1,422,524, approximately $487 per square foot. 2145 Lincoln Ave is a home located in Alameda County with nearby schools including Love Elementary, Will C. Wood Middle School, and Alameda High School.
Ownership History
Date
Name
Owned For
Owner Type
Purchase Details
Closed on
Mar 22, 2021
Sold by
Chang Meilong and Chen Jimmy T
Bought by
Chang Meilong and The Mei Long Chang Revocable T
Current Estimated Value
Purchase Details
Closed on
Jul 26, 2011
Sold by
Chang Mei Long
Bought by
Chang Mei Long and Chen Jimmy T Y
Purchase Details
Closed on
Aug 25, 2000
Sold by
Trunzo Vincent R
Bought by
Chang Mei Long
Home Financials for this Owner
Home Financials are based on the most recent Mortgage that was taken out on this home.
Original Mortgage
$323,400
Outstanding Balance
$118,703
Interest Rate
8.2%
Estimated Equity
$1,303,821
Purchase Details
Closed on
Jul 28, 1999
Sold by
Caldwell Mark R and Caldwell Kristen
Bought by
Trunoz Vincent R
Home Financials for this Owner
Home Financials are based on the most recent Mortgage that was taken out on this home.
Original Mortgage
$300,000
Interest Rate
8.99%
Create a Home Valuation Report for This Property
The Home Valuation Report is an in-depth analysis detailing your home's value as well as a comparison with similar homes in the area
Home Values in the Area
Average Home Value in this Area
Purchase History
| Date | Buyer | Sale Price | Title Company |
|---|---|---|---|
| Chang Meilong | -- | None Available | |
| Chang Mei Long | -- | None Available | |
| Chang Mei Long | $530,000 | Chicago Title Co | |
| Trunzo Vincent R | -- | Chicago Title Co | |
| Trunoz Vincent R | $378,500 | Placer Title Company |
Source: Public Records
Mortgage History
| Date | Status | Borrower | Loan Amount |
|---|---|---|---|
| Open | Chang Mei Long | $323,400 | |
| Previous Owner | Trunoz Vincent R | $300,000 | |
| Closed | Trunoz Vincent R | $48,000 | |
| Closed | Chang Mei Long | $24,333 |
Source: Public Records
Tax History Compared to Growth
Tax History
| Year | Tax Paid | Tax Assessment Tax Assessment Total Assessment is a certain percentage of the fair market value that is determined by local assessors to be the total taxable value of land and additions on the property. | Land | Improvement |
|---|---|---|---|---|
| 2025 | $13,161 | $798,566 | $239,570 | $558,996 |
| 2024 | $13,161 | $782,910 | $234,873 | $548,037 |
| 2023 | $12,697 | $767,561 | $230,268 | $537,293 |
| 2022 | $12,426 | $752,514 | $225,754 | $526,760 |
| 2021 | $12,137 | $737,760 | $221,328 | $516,432 |
| 2020 | $11,991 | $730,196 | $219,059 | $511,137 |
| 2019 | $11,084 | $715,881 | $214,764 | $501,117 |
| 2018 | $10,817 | $701,847 | $210,554 | $491,293 |
| 2017 | $10,352 | $688,087 | $206,426 | $481,661 |
| 2016 | $10,351 | $674,598 | $202,379 | $472,219 |
| 2015 | $10,309 | $664,471 | $199,341 | $465,130 |
| 2014 | $10,045 | $651,460 | $195,438 | $456,022 |
Source: Public Records
Map
Nearby Homes
- 2109 Lincoln Ave
- 1611 Lea Ct
- 2216 Santa Clara Ave
- 2061 Buena Vista Ave
- 2056 Santa Clara Ave
- 2057 Central Ave
- 2151 Alameda Ave
- 2119 Alameda Ave
- 2310 Pacific Ave
- 2055 Clement Ave
- 1421 Chestnut St
- 2120 Encinal Ave
- 2256 Stanford St
- 2015 Stanford St
- 2007 Stanford St
- 2364 Stanford St
- 2308 Encinal Ave
- 1220 Chestnut St
- Plan 3 at Alameda Marina - Waterside
- 2388 Stanford St
- 2149 Lincoln Ave
- 2143 Lincoln Ave
- 2139 Lincoln Ave
- 2151 Lincoln Ave
- 2137 Lincoln Ave
- 2153 Lincoln Ave
- 2140 Pacific Ave
- 2142 Pacific Ave
- 2157 Lincoln Ave
- 2138 Pacific Ave
- 2150 Pacific Ave
- 2152 Pacific Ave
- 2136 Pacific Ave
- 2129 Lincoln Ave
- 2161 Lincoln Ave
- 2154 Pacific Ave
- 2132 Pacific Ave
- 2156 Pacific Ave
- 2163 Lincoln Ave
- 2128 Pacific Ave