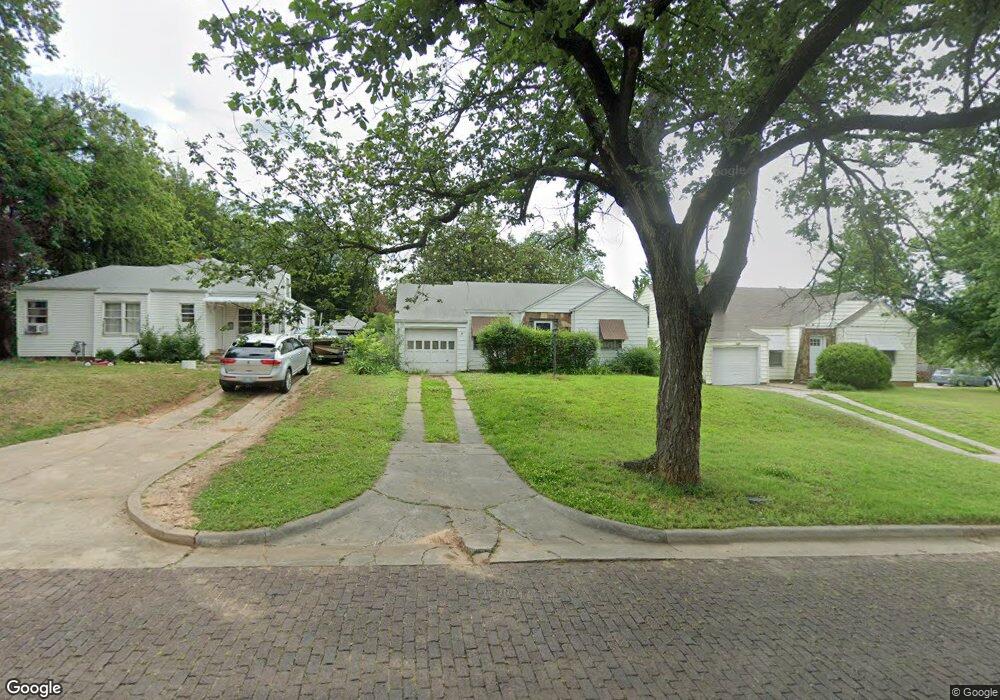
215 S 10th St Unit 80 Ponca City, OK 74601
Estimated Value: $62,000 - $91,000
3
Beds
1
Bath
865
Sq Ft
$84/Sq Ft
Est. Value
About This Home
This home is located at 215 S 10th St Unit 80, Ponca City, OK 74601 and is currently estimated at $72,778, approximately $84 per square foot. 215 S 10th St Unit 80 is a home located in Kay County with nearby schools including Garfield Elementary School, Ponca City East Middle School, and Ponca City West Middle School.
Ownership History
Date
Name
Owned For
Owner Type
Purchase Details
Closed on
Nov 22, 2011
Sold by
Andrews Kenneth L
Bought by
Kings Tracy D
Current Estimated Value
Purchase Details
Closed on
May 17, 2011
Sold by
Andrews Carol L
Bought by
Andrews Kenneth L
Purchase Details
Closed on
May 3, 2011
Sold by
Andrews Carol L
Bought by
Andrews Kenneth L
Purchase Details
Closed on
Aug 13, 2010
Sold by
Hardridge Joe T and Hardridge Deborah G
Bought by
Andrews Kenneth L
Home Financials for this Owner
Home Financials are based on the most recent Mortgage that was taken out on this home.
Original Mortgage
$34,000
Interest Rate
4.54%
Mortgage Type
Purchase Money Mortgage
Purchase Details
Closed on
Dec 31, 2002
Sold by
Sandra Chandler
Bought by
Deborah Joe and Deborah Hardridge
Purchase Details
Closed on
Aug 30, 1995
Sold by
Rex Curtis Johnson
Bought by
Georgia B Mc Caleb
Purchase Details
Closed on
May 1, 1985
Sold by
Rex Curtis Johnson
Bought by
Georgia B Mc Caleb
Create a Home Valuation Report for This Property
The Home Valuation Report is an in-depth analysis detailing your home's value as well as a comparison with similar homes in the area
Home Values in the Area
Average Home Value in this Area
Purchase History
| Date | Buyer | Sale Price | Title Company |
|---|---|---|---|
| Kings Tracy D | $45,000 | Stewart Escrow & Title | |
| Andrews Kenneth L | -- | -- | |
| Andrews Kenneth L | -- | -- | |
| Andrews Kenneth L | $36,000 | -- | |
| Deborah Joe | $31,000 | -- | |
| Georgia B Mc Caleb | $31,000 | -- | |
| Georgia B Mc Caleb | $54,000 | -- |
Source: Public Records
Mortgage History
| Date | Status | Borrower | Loan Amount |
|---|---|---|---|
| Previous Owner | Andrews Kenneth L | $34,000 |
Source: Public Records
Tax History Compared to Growth
Tax History
| Year | Tax Paid | Tax Assessment Tax Assessment Total Assessment is a certain percentage of the fair market value that is determined by local assessors to be the total taxable value of land and additions on the property. | Land | Improvement |
|---|---|---|---|---|
| 2024 | $335 | $4,535 | $495 | $4,040 |
| 2023 | $335 | $4,403 | $495 | $3,908 |
| 2022 | $312 | $4,275 | $495 | $3,780 |
| 2021 | $313 | $4,275 | $495 | $3,780 |
| 2020 | $308 | $4,250 | $495 | $3,755 |
| 2019 | $299 | $4,126 | $495 | $3,631 |
| 2018 | $310 | $4,201 | $495 | $3,706 |
| 2017 | $321 | $4,275 | $495 | $3,780 |
| 2016 | $324 | $4,275 | $495 | $3,780 |
| 2015 | $325 | $4,265 | $495 | $3,770 |
| 2014 | $322 | $4,300 | $495 | $3,805 |
Source: Public Records
Map
Nearby Homes
- 310 S 9th St
- 213 N 10th St
- 216 N 12th St Unit 840
- 202 N 7th St
- 701 S 8th St
- 800 S 12th St
- 310 N 7th St Unit 660
- 410 Drake Dr
- 408 S 4th St
- 409 N 5th St
- 1001 S 9th St
- 212 E Ponca Ave
- 815 E Madison Ave
- 417 S 2nd St
- 525 Monument Rd
- 1020 S 8th St
- 417 N 3rd St
- 1103 S 6th St
- 1220 S 8th St Unit 480
- 214 Virginia Ave
- 207 S 10th St
- 217 S 10th St Unit 80
- 1004 E Central Ave
- 214 S 11th St Unit 80
- 218 S 11th St
- 301 S 10th St Unit 80
- 1020 E Central Ave
- 210 S 10th St
- 220 S 10th St
- 300 S 11th St Unit 80
- 303 S 10th St
- 300 S 10th St
- 304 S 11th St
- 304 S 10th St
- 910 E Central Ave
- 306 S 11th St
- 308 S 10th St
- 315 S 10th St
- 908 E Central Ave
- 219 S 11th St Unit 80