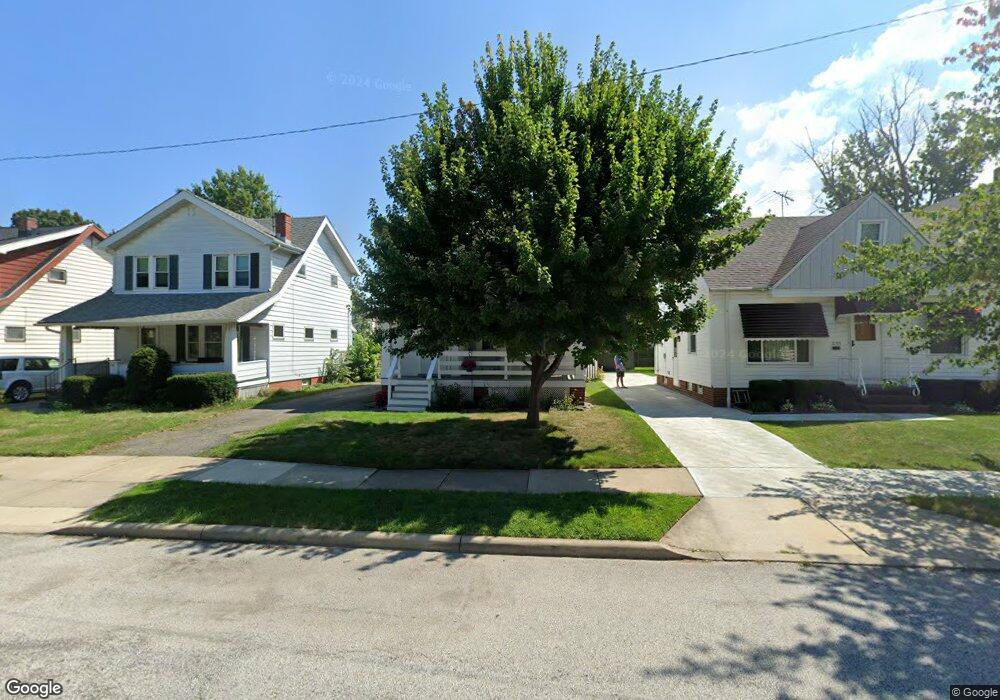
2151 Chesterland Ave Lakewood, OH 44107
Estimated Value: $217,343 - $287,000
3
Beds
1
Bath
1,200
Sq Ft
$216/Sq Ft
Est. Value
About This Home
This home is located at 2151 Chesterland Ave, Lakewood, OH 44107 and is currently estimated at $259,586, approximately $216 per square foot. 2151 Chesterland Ave is a home located in Cuyahoga County with nearby schools including Roosevelt Elementary School, Garfield Middle School, and Lakewood High School.
Ownership History
Date
Name
Owned For
Owner Type
Purchase Details
Closed on
Dec 28, 1998
Sold by
Phelps Mary R
Bought by
Balmer Karen S
Current Estimated Value
Home Financials for this Owner
Home Financials are based on the most recent Mortgage that was taken out on this home.
Original Mortgage
$82,822
Interest Rate
6.88%
Mortgage Type
FHA
Purchase Details
Closed on
Dec 23, 1986
Sold by
Daly John R
Bought by
Phelps Mary R
Purchase Details
Closed on
Oct 20, 1983
Sold by
Fitzgerald John F and Fitzgerald Nadine C
Bought by
Daly John R
Purchase Details
Closed on
Jun 28, 1979
Sold by
Fitzgerald John F
Bought by
Fitzgerald John F and Fitzgerald Nadine C
Purchase Details
Closed on
May 11, 1978
Sold by
Yendrek Robert J and Yendrek Betty A
Bought by
Fitzgerald John F
Purchase Details
Closed on
Jan 1, 1975
Bought by
Yendrek Robert J and Yendrek Betty A
Create a Home Valuation Report for This Property
The Home Valuation Report is an in-depth analysis detailing your home's value as well as a comparison with similar homes in the area
Home Values in the Area
Average Home Value in this Area
Purchase History
| Date | Buyer | Sale Price | Title Company |
|---|---|---|---|
| Balmer Karen S | $84,500 | Chicago Title Insurance Comp | |
| Phelps Mary R | $50,800 | -- | |
| Daly John R | $50,000 | -- | |
| Fitzgerald John F | $43,000 | -- | |
| Fitzgerald John F | $44,200 | -- | |
| Yendrek Robert J | -- | -- |
Source: Public Records
Mortgage History
| Date | Status | Borrower | Loan Amount |
|---|---|---|---|
| Previous Owner | Balmer Karen S | $82,822 |
Source: Public Records
Tax History Compared to Growth
Tax History
| Year | Tax Paid | Tax Assessment Tax Assessment Total Assessment is a certain percentage of the fair market value that is determined by local assessors to be the total taxable value of land and additions on the property. | Land | Improvement |
|---|---|---|---|---|
| 2024 | $2,855 | $54,250 | $17,360 | $36,890 |
| 2023 | $2,701 | $45,150 | $13,370 | $31,780 |
| 2022 | $2,749 | $45,150 | $13,370 | $31,780 |
| 2021 | $2,721 | $45,150 | $13,370 | $31,780 |
| 2020 | $2,245 | $35,000 | $10,360 | $24,640 |
| 2019 | $2,201 | $100,000 | $29,600 | $70,400 |
| 2018 | $2,197 | $35,000 | $10,360 | $24,640 |
| 2017 | $2,822 | $30,630 | $8,370 | $22,260 |
| 2016 | $2,803 | $30,630 | $8,370 | $22,260 |
| 2015 | $2,804 | $30,630 | $8,370 | $22,260 |
| 2014 | $2,804 | $29,440 | $8,050 | $21,390 |
Source: Public Records
Map
Nearby Homes
- 2070 Clarence Ave
- 2180 Lewis Dr
- 2045 Chesterland Ave
- 2208 Waterbury Rd
- 2035 Chesterland Ave
- 2204 Lewis Dr
- 2180 Elbur Ave
- 2219 Waterbury Rd
- 2100 Wascana Ave
- 2203 Bunts Rd
- 2233 Bunts Rd
- 2026 Dowd Ave
- 12701 Plover St
- 1617 Clarence Ave
- 12511 Plover St
- 14031 Lakewood Heights Blvd
- 1605 Lewis Dr
- 12311 Plover St
- 1603 Cohassett Ave
- 2023 Robin St
- 2155 Chesterland Ave
- 2147 Chesterland Ave
- 2159 Chesterland Ave
- 2143 Chesterland Ave
- 2139 2141 Chesterland Ave
- 2163 Chesterland Ave
- 2163 Chesterland Ave Unit Upstairs
- 2139 Chesterland Ave
- 2148 Waterbury Rd
- 2152 Waterbury Rd
- 2142 Waterbury Rd
- 2154 Waterbury Rd
- 2144 Waterbury Rd
- 2156 Waterbury Rd
- 2138 Waterbury Rd
- 2135 Chesterland Ave
- 2167 Chesterland Ave
- 2150 Chesterland Ave
- 2160 Waterbury Rd
- 2154 Chesterland Ave