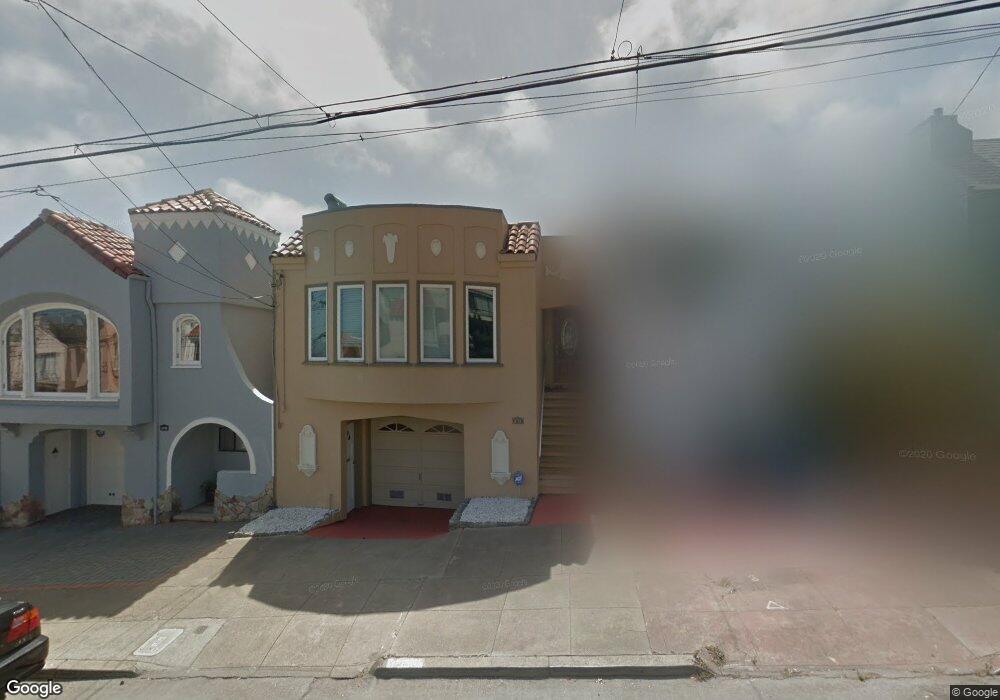
2155 26th Ave San Francisco, CA 94116
Parkside NeighborhoodEstimated Value: $1,826,000 - $2,229,000
4
Beds
5
Baths
2,225
Sq Ft
$902/Sq Ft
Est. Value
About This Home
This home is located at 2155 26th Ave, San Francisco, CA 94116 and is currently estimated at $2,006,653, approximately $901 per square foot. 2155 26th Ave is a home located in San Francisco County with nearby schools including Dianne Feinstein Elementary, Aptos Middle School, and Cornerstone Academy-Lawton Campus.
Ownership History
Date
Name
Owned For
Owner Type
Purchase Details
Closed on
Oct 19, 2021
Sold by
Chiu Yen and Pai Wendy
Bought by
Chiu Charles Yen and Chiu Wendy Pai
Current Estimated Value
Purchase Details
Closed on
Jul 1, 2009
Sold by
Su Nancy Ying Nuan
Bought by
Chiu Charles Yen and Chiu Wendy Pai
Home Financials for this Owner
Home Financials are based on the most recent Mortgage that was taken out on this home.
Original Mortgage
$417,000
Outstanding Balance
$264,878
Interest Rate
4.79%
Mortgage Type
Purchase Money Mortgage
Estimated Equity
$1,741,775
Purchase Details
Closed on
Oct 6, 2008
Sold by
Liang Jack
Bought by
Su Nancy Ying Nuan
Purchase Details
Closed on
Oct 10, 2007
Sold by
Pulido Gloria and Pulido Living Trust
Bought by
Pulido Gloria M and Frank Pulido Jr Trust
Purchase Details
Closed on
May 18, 1995
Sold by
Pulido Frank M and Pulido Julia S
Bought by
Pulido Julia S
Create a Home Valuation Report for This Property
The Home Valuation Report is an in-depth analysis detailing your home's value as well as a comparison with similar homes in the area
Home Values in the Area
Average Home Value in this Area
Purchase History
| Date | Buyer | Sale Price | Title Company |
|---|---|---|---|
| Chiu Charles Yen | -- | None Available | |
| Chiu Charles Yen | $912,000 | Chicago Title Company | |
| Su Nancy Ying Nuan | -- | Chicago Title Company | |
| Su Nancy Ying Nuan | $720,000 | Chicago Title Company | |
| Pulido Gloria M | -- | None Available | |
| Pulido Gloria M | -- | None Available | |
| Pulido Julia S | -- | -- |
Source: Public Records
Mortgage History
| Date | Status | Borrower | Loan Amount |
|---|---|---|---|
| Open | Chiu Charles Yen | $417,000 |
Source: Public Records
Tax History Compared to Growth
Tax History
| Year | Tax Paid | Tax Assessment Tax Assessment Total Assessment is a certain percentage of the fair market value that is determined by local assessors to be the total taxable value of land and additions on the property. | Land | Improvement |
|---|---|---|---|---|
| 2025 | $14,227 | $1,177,221 | $824,058 | $353,163 |
| 2024 | $14,227 | $1,154,139 | $807,900 | $346,239 |
| 2023 | $14,009 | $1,131,509 | $792,059 | $339,450 |
| 2022 | $13,737 | $1,109,324 | $776,529 | $332,795 |
| 2021 | $13,491 | $1,087,573 | $761,303 | $326,270 |
| 2020 | $13,557 | $1,076,422 | $753,497 | $322,925 |
| 2019 | $13,092 | $1,055,317 | $738,723 | $316,594 |
| 2018 | $12,650 | $1,034,626 | $724,239 | $310,387 |
| 2017 | $12,201 | $1,014,340 | $710,039 | $304,301 |
| 2016 | $11,996 | $994,452 | $696,117 | $298,335 |
| 2015 | $11,846 | $979,515 | $685,661 | $293,854 |
| 2014 | $11,533 | $960,328 | $672,230 | $288,098 |
Source: Public Records
Map
Nearby Homes