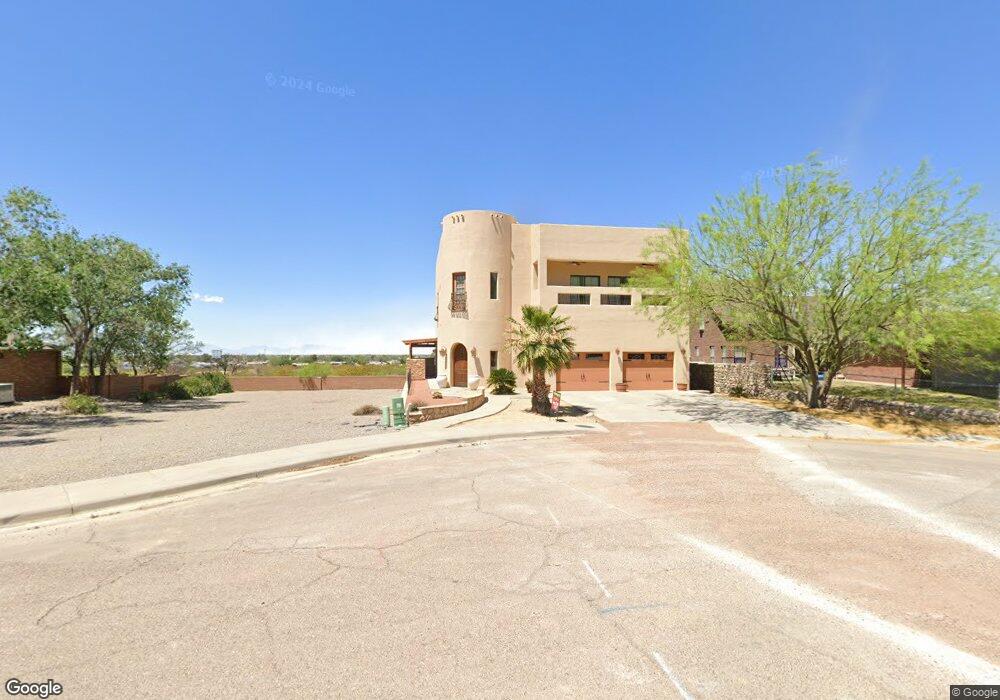
2155 Pinehurst Ct Unit 13 Alamogordo, NM 88310
Estimated Value: $272,000 - $445,000
4
Beds
4
Baths
3,779
Sq Ft
$100/Sq Ft
Est. Value
About This Home
This home is located at 2155 Pinehurst Ct Unit 13, Alamogordo, NM 88310 and is currently estimated at $379,754, approximately $100 per square foot. 2155 Pinehurst Ct Unit 13 is a home located in Otero County with nearby schools including Yucca Elementary School, Sierra Elementary School, and Mountain View Middle School.
Ownership History
Date
Name
Owned For
Owner Type
Purchase Details
Closed on
Feb 7, 2008
Sold by
Ferrara Rosemarie
Bought by
Bednorz Ardel R and Bednorz Debra D
Current Estimated Value
Home Financials for this Owner
Home Financials are based on the most recent Mortgage that was taken out on this home.
Original Mortgage
$250,000
Outstanding Balance
$167,226
Interest Rate
7.25%
Mortgage Type
Construction
Estimated Equity
$212,528
Purchase Details
Closed on
Aug 8, 2006
Sold by
Kiehl Daniel L
Bought by
Ferrara Rosemarie
Home Financials for this Owner
Home Financials are based on the most recent Mortgage that was taken out on this home.
Original Mortgage
$129,693
Interest Rate
8.25%
Mortgage Type
Construction
Purchase Details
Closed on
Nov 18, 2005
Sold by
Mikesell Theodore L
Bought by
Kiehl Daniel L
Create a Home Valuation Report for This Property
The Home Valuation Report is an in-depth analysis detailing your home's value as well as a comparison with similar homes in the area
Home Values in the Area
Average Home Value in this Area
Purchase History
| Date | Buyer | Sale Price | Title Company |
|---|---|---|---|
| Bednorz Ardel R | -- | None Available | |
| Ferrara Rosemarie | -- | None Available | |
| Kiehl Daniel L | -- | None Available | |
| Kiehl Daniel L | -- | None Available |
Source: Public Records
Mortgage History
| Date | Status | Borrower | Loan Amount |
|---|---|---|---|
| Open | Bednorz Ardel R | $250,000 | |
| Previous Owner | Ferrara Rosemarie | $129,693 |
Source: Public Records
Tax History Compared to Growth
Tax History
| Year | Tax Paid | Tax Assessment Tax Assessment Total Assessment is a certain percentage of the fair market value that is determined by local assessors to be the total taxable value of land and additions on the property. | Land | Improvement |
|---|---|---|---|---|
| 2025 | $3,836 | $150,329 | $5,107 | $145,222 |
| 2024 | $3,706 | $145,950 | $4,886 | $141,064 |
| 2023 | $3,662 | $141,699 | $4,646 | $137,053 |
| 2022 | $3,581 | $137,572 | $4,646 | $132,926 |
| 2021 | $3,598 | $136,585 | $4,646 | $131,939 |
| 2020 | $3,598 | $136,585 | $4,646 | $131,939 |
| 2019 | $3,549 | $133,907 | $4,555 | $129,352 |
| 2018 | $3,454 | $132,581 | $4,510 | $128,059 |
| 2017 | $3,179 | $129,982 | $4,421 | $125,547 |
| 2016 | $3,093 | $127,433 | $0 | $0 |
| 2015 | $3,030 | $124,934 | $0 | $0 |
| 2014 | -- | $122,486 | $4,167 | $118,319 |
Source: Public Records
Map
Nearby Homes
- 2303 Tulane Ave
- 2302 Princeton Ave
- 2402 Tulane Ave
- 1807 Dewey Ln
- 2404 Westminster Ave
- 2406 Westminster Ave
- 2413 Princeton Ave
- 1908 Snow Dr
- 2321 Camino Del Rey
- 2407 Cambridge Ave
- 1900 Hubbard Dr
- 1814 College Ave
- 2815 Indian Wells Rd
- 1608 Indian Wells Rd Unit 2
- 2301 Pecan Dr
- 2415 Stanford Ave
- 2506 Stanford Ave
- 1841 Corte Del Sol
- 1311 Desert Dawn Dr
- 2604 Princeton Ave
- 2155 Pinehurst Ct
- 2145 Pinehurst Ct
- 2165 Pinehurst Ct
- 2135 Pinehurst Ct
- 2164 Pinehurst Ct
- 2144 Pinehurst Ct
- 2154 Pinehurst Ct Unit 16
- 2134 Pinehurst Ct
- 2100 Hickory Dr
- 2110 Hickory Dr
- 2120 Hickory Dr
- 2143 Sandalwood Ct
- 2130 Hickory Dr
- 2133 Sandalwood Ct
- 2100 23rd St
- 2140 Hickory Dr
- 2163 Sandalwood Ct
- 2010 23rd St
- 2200 23rd St
- 2150 Hickory Dr