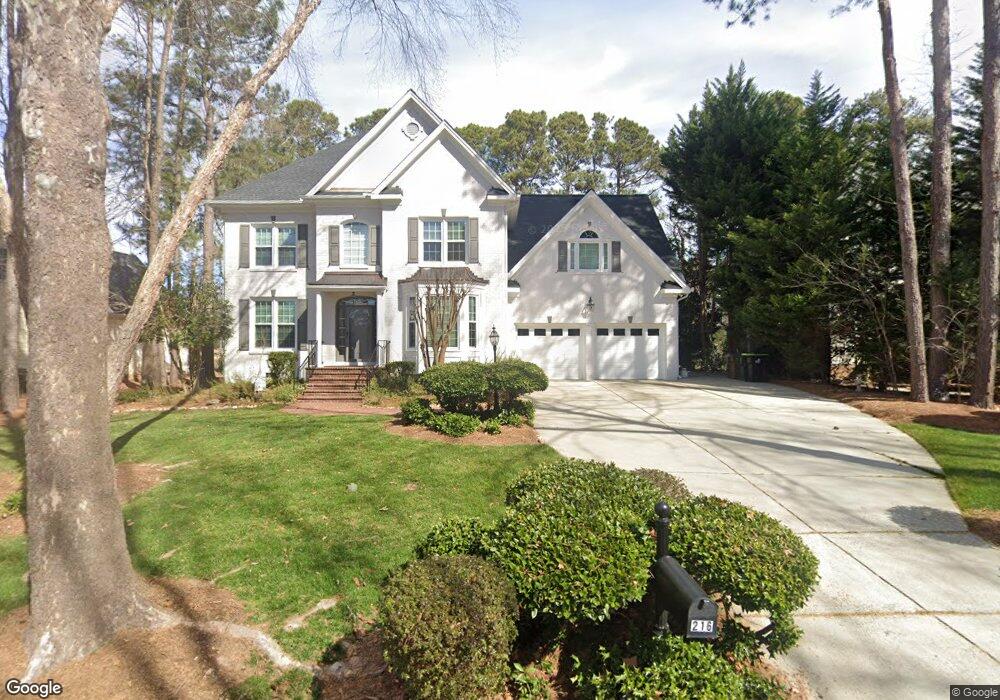
216 Kenmont Dr Holly Springs, NC 27540
Estimated Value: $752,832 - $846,000
4
Beds
3
Baths
3,250
Sq Ft
$247/Sq Ft
Est. Value
About This Home
This home is located at 216 Kenmont Dr, Holly Springs, NC 27540 and is currently estimated at $804,208, approximately $247 per square foot. 216 Kenmont Dr is a home located in Wake County with nearby schools including Holly Ridge Elementary School, Holly Ridge Middle School, and Holly Springs High School.
Ownership History
Date
Name
Owned For
Owner Type
Purchase Details
Closed on
Jan 11, 2008
Sold by
Janus Deanna L
Bought by
Garner Timothy C and Garner Kathi L
Current Estimated Value
Home Financials for this Owner
Home Financials are based on the most recent Mortgage that was taken out on this home.
Original Mortgage
$319,200
Outstanding Balance
$200,327
Interest Rate
6.05%
Mortgage Type
Purchase Money Mortgage
Estimated Equity
$603,881
Purchase Details
Closed on
Jul 23, 2001
Sold by
Janus David W
Bought by
Janus Deanna
Purchase Details
Closed on
Jan 19, 2000
Sold by
Woodard Builders Inc
Bought by
Janus David W and Janus Deanna L
Home Financials for this Owner
Home Financials are based on the most recent Mortgage that was taken out on this home.
Original Mortgage
$343,900
Interest Rate
7.87%
Purchase Details
Closed on
May 28, 1999
Sold by
Sunset Forest Llc
Bought by
Woodard Builders Inc
Create a Home Valuation Report for This Property
The Home Valuation Report is an in-depth analysis detailing your home's value as well as a comparison with similar homes in the area
Home Values in the Area
Average Home Value in this Area
Purchase History
| Date | Buyer | Sale Price | Title Company |
|---|---|---|---|
| Garner Timothy C | $399,000 | None Available | |
| Janus Deanna | -- | -- | |
| Janus Deanna | -- | -- | |
| Janus David W | $362,000 | -- | |
| Woodard Builders Inc | $55,000 | -- |
Source: Public Records
Mortgage History
| Date | Status | Borrower | Loan Amount |
|---|---|---|---|
| Open | Garner Timothy C | $319,200 | |
| Closed | Garner Timothy C | $59,850 | |
| Previous Owner | Janus David W | $343,900 |
Source: Public Records
Tax History Compared to Growth
Tax History
| Year | Tax Paid | Tax Assessment Tax Assessment Total Assessment is a certain percentage of the fair market value that is determined by local assessors to be the total taxable value of land and additions on the property. | Land | Improvement |
|---|---|---|---|---|
| 2025 | $6,669 | $772,565 | $195,000 | $577,565 |
| 2024 | $6,641 | $772,565 | $195,000 | $577,565 |
| 2023 | $5,024 | $463,933 | $77,000 | $386,933 |
| 2022 | $4,850 | $463,933 | $77,000 | $386,933 |
| 2021 | $4,760 | $463,933 | $77,000 | $386,933 |
| 2020 | $4,760 | $463,933 | $77,000 | $386,933 |
| 2019 | $5,198 | $430,341 | $70,000 | $360,341 |
| 2018 | $4,697 | $430,341 | $70,000 | $360,341 |
| 2017 | $4,528 | $430,341 | $70,000 | $360,341 |
| 2016 | $4,465 | $430,341 | $70,000 | $360,341 |
| 2015 | $5,023 | $476,700 | $113,050 | $363,650 |
| 2014 | $4,849 | $476,700 | $113,050 | $363,650 |
Source: Public Records
Map
Nearby Homes
- 5317 Moonflower Ct
- 101 Eden Glen Dr
- 108 Eden Glen Dr
- 501 Wescott Ridge Dr
- 4225 Olive Hill Dr
- 212 Chieftain Dr
- 4900 Optimist Farm Rd
- 4830 Optimist Farm Rd
- 120 Breyla Way
- 5420 Lake Edge Dr
- 104 Amberglen Ln
- 608 Skygrove Dr
- 436 Edgepine Dr
- 129 Middlegreen Place
- 121 Amberglen Ln
- 4809 Greenpoint Ln
- 0 Optimist Farm Rd Unit 10126506
- 5309 Shoreline Ct
- 204 Edgepine Dr
- 109 Skywater Ln
- 212 Kenmont Dr
- 220 Kenmont Dr
- 208 Kenmont Dr
- 205 Kenmont Dr
- 213 Kenmont Dr
- 215 Kenmont Dr
- 204 Kenmont Dr
- 219 Kenmont Dr
- 228 Kenmont Dr
- 209 Kenmont Dr
- 261 Elmcrest Dr
- 201 Kenmont Dr
- 221 Kenmont Dr
- 257 Elmcrest Dr
- 200 Kenmont Dr
- 253 Elmcrest Dr
- 245 Kenmont Dr
- 223 Kenmont Dr
- 243 Kenmont Dr
- 225 Kenmont Dr