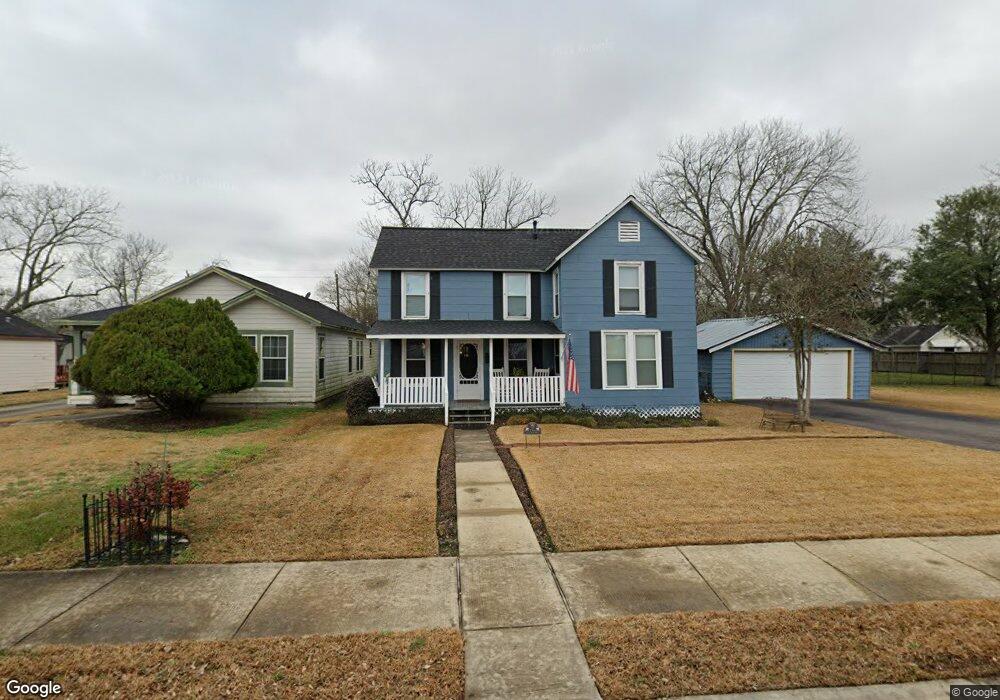
216 S 3rd St La Porte, TX 77571
Estimated Value: $164,000 - $249,000
3
Beds
2
Baths
1,685
Sq Ft
$124/Sq Ft
Est. Value
About This Home
This home is located at 216 S 3rd St, La Porte, TX 77571 and is currently estimated at $208,913, approximately $123 per square foot. 216 S 3rd St is a home located in Harris County with nearby schools including La Porte Elementary School, La Porte Junior High School, and La Porte High School.
Ownership History
Date
Name
Owned For
Owner Type
Purchase Details
Closed on
Aug 28, 2014
Sold by
Gw Acquisitions Llc
Bought by
Holden Daniel and Holden Virginia
Current Estimated Value
Purchase Details
Closed on
Nov 28, 2011
Sold by
Fannie Mae
Bought by
Schreiber Henry L
Purchase Details
Closed on
Oct 4, 2011
Sold by
Citimortgage Inc
Bought by
Federal National Mortgage Association
Purchase Details
Closed on
Feb 6, 2007
Sold by
Basaldu Belinda White and Basaldu Phillip
Bought by
Moses Walter Allen
Home Financials for this Owner
Home Financials are based on the most recent Mortgage that was taken out on this home.
Original Mortgage
$13,750
Interest Rate
6.17%
Mortgage Type
Stand Alone Second
Create a Home Valuation Report for This Property
The Home Valuation Report is an in-depth analysis detailing your home's value as well as a comparison with similar homes in the area
Home Values in the Area
Average Home Value in this Area
Purchase History
| Date | Buyer | Sale Price | Title Company |
|---|---|---|---|
| Holden Daniel | -- | None Available | |
| Schreiber Henry L | -- | None Available | |
| Federal National Mortgage Association | -- | None Available | |
| Citimortgage Inc | $43,281 | None Available | |
| Moses Walter Allen | -- | Stewart Title Houston Div |
Source: Public Records
Mortgage History
| Date | Status | Borrower | Loan Amount |
|---|---|---|---|
| Previous Owner | Moses Walter Allen | $13,750 | |
| Previous Owner | Moses Walter Allen | $41,250 |
Source: Public Records
Tax History Compared to Growth
Tax History
| Year | Tax Paid | Tax Assessment Tax Assessment Total Assessment is a certain percentage of the fair market value that is determined by local assessors to be the total taxable value of land and additions on the property. | Land | Improvement |
|---|---|---|---|---|
| 2025 | $2,787 | $138,883 | $55,781 | $83,102 |
| 2024 | $2,787 | $133,970 | $55,781 | $78,189 |
| 2023 | $2,787 | $161,504 | $55,781 | $105,723 |
| 2022 | $2,847 | $133,375 | $55,781 | $77,594 |
| 2021 | $2,649 | $107,749 | $52,500 | $55,249 |
| 2020 | $2,465 | $91,605 | $32,813 | $58,792 |
| 2019 | $2,338 | $89,993 | $32,813 | $57,180 |
| 2018 | $0 | $73,860 | $19,688 | $54,172 |
| 2017 | $1,960 | $66,910 | $16,406 | $50,504 |
| 2016 | $1,782 | $60,466 | $16,406 | $44,060 |
| 2015 | $1,748 | $58,636 | $16,406 | $42,230 |
| 2014 | $1,748 | $58,636 | $16,406 | $42,230 |
Source: Public Records
Map
Nearby Homes
- 416 S 1st St
- 114 Dr Martin Luther King jr Dr
- 111 N 6th St
- 0 N 1st Ave
- 208 S 7th St
- 216 San Jacinto St
- 507 S 3rd St
- 0 Broadway Unit 47596766
- 424 S Broadway St
- 123 S Virginia St
- 531 S 2nd St
- 1200 BLOCK S 2nd St
- 131 S Virginia St
- 135 S Virginia St
- 317 San Jacinto St
- 301 S Virginia St
- 407 San Jacinto St
- 422 N 7th St
- 314 E Main St
- 0 S 7th Unit 2930812