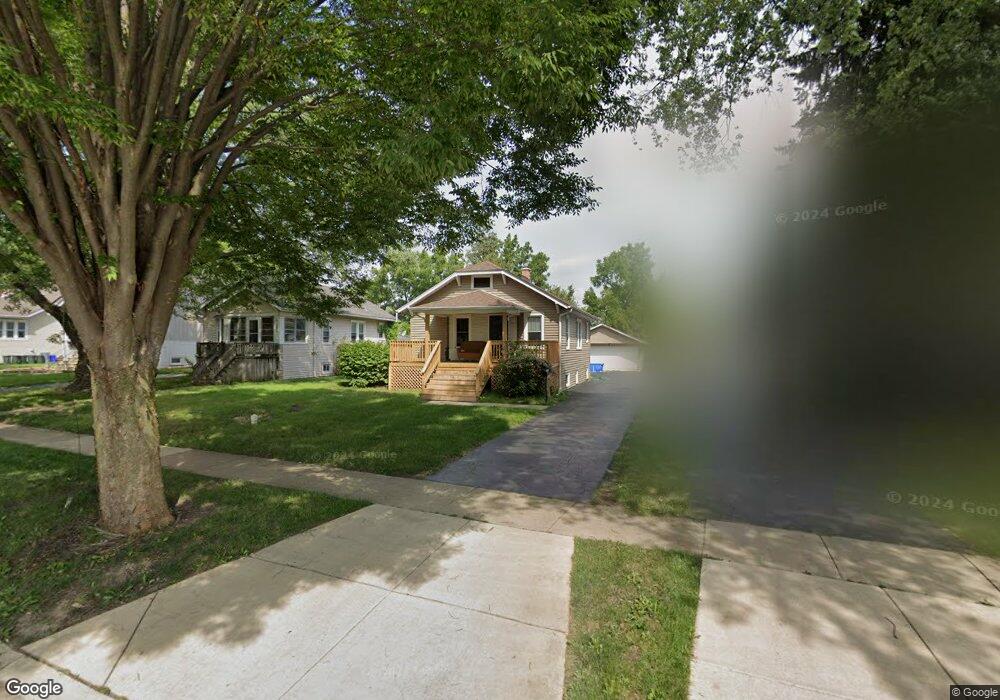
216 W Kenilworth Ave Villa Park, IL 60181
Estimated Value: $316,035 - $339,000
2
Beds
1
Bath
768
Sq Ft
$423/Sq Ft
Est. Value
About This Home
This home is located at 216 W Kenilworth Ave, Villa Park, IL 60181 and is currently estimated at $324,759, approximately $422 per square foot. 216 W Kenilworth Ave is a home located in DuPage County with nearby schools including Ardmore Elementary School, Jackson Middle School, and Willowbrook High School.
Ownership History
Date
Name
Owned For
Owner Type
Purchase Details
Closed on
Jul 1, 2022
Sold by
Catania Antonino P and Catania Maria
Bought by
Catania Antonino P and Catania Maria
Current Estimated Value
Home Financials for this Owner
Home Financials are based on the most recent Mortgage that was taken out on this home.
Original Mortgage
$212,500
Outstanding Balance
$180,126
Interest Rate
5.13%
Mortgage Type
New Conventional
Estimated Equity
$144,633
Purchase Details
Closed on
Dec 2, 2002
Sold by
Kurz Karen M and Wheat Neal
Bought by
Catania Antonino P
Home Financials for this Owner
Home Financials are based on the most recent Mortgage that was taken out on this home.
Original Mortgage
$167,800
Interest Rate
6.25%
Purchase Details
Closed on
Nov 15, 2000
Sold by
Kangas Matthew W and Kangas Laura L
Bought by
Kurz Karen M
Home Financials for this Owner
Home Financials are based on the most recent Mortgage that was taken out on this home.
Original Mortgage
$126,800
Interest Rate
7.77%
Create a Home Valuation Report for This Property
The Home Valuation Report is an in-depth analysis detailing your home's value as well as a comparison with similar homes in the area
Home Values in the Area
Average Home Value in this Area
Purchase History
| Date | Buyer | Sale Price | Title Company |
|---|---|---|---|
| Catania Antonino P | -- | Churchill Title Solutions | |
| Catania Antonino P | $173,000 | First American Title | |
| Kurz Karen M | $158,500 | -- |
Source: Public Records
Mortgage History
| Date | Status | Borrower | Loan Amount |
|---|---|---|---|
| Open | Catania Antonino P | $212,500 | |
| Previous Owner | Catania Antonino P | $167,800 | |
| Previous Owner | Kurz Karen M | $126,800 |
Source: Public Records
Tax History Compared to Growth
Tax History
| Year | Tax Paid | Tax Assessment Tax Assessment Total Assessment is a certain percentage of the fair market value that is determined by local assessors to be the total taxable value of land and additions on the property. | Land | Improvement |
|---|---|---|---|---|
| 2024 | $6,397 | $92,644 | $36,173 | $56,471 |
| 2023 | $6,082 | $85,670 | $33,450 | $52,220 |
| 2022 | $5,937 | $82,360 | $32,160 | $50,200 |
| 2021 | $5,693 | $80,310 | $31,360 | $48,950 |
| 2020 | $5,555 | $78,550 | $30,670 | $47,880 |
| 2019 | $5,181 | $74,680 | $29,160 | $45,520 |
| 2018 | $4,926 | $67,330 | $26,290 | $41,040 |
| 2017 | $4,802 | $64,160 | $25,050 | $39,110 |
| 2016 | $4,658 | $60,440 | $23,600 | $36,840 |
| 2015 | $4,583 | $56,310 | $21,990 | $34,320 |
| 2014 | $4,382 | $54,290 | $32,850 | $21,440 |
| 2013 | $4,178 | $55,050 | $33,310 | $21,740 |
Source: Public Records
Map
Nearby Homes
- 37 N Addison Rd
- 114 E Kenilworth Ave
- 935 E Saint Charles Rd
- 235 N Ardmore Ave
- 247 N Ardmore Ave
- 912 E Saint Charles Rd
- 1041 E Division St
- 417 W Terrace St
- 194 Washington St
- 58 E Division St
- 118 S Highland Ave
- 5 E Washington St
- 208 S Highland Ave
- 736 E Saint Charles Rd
- 434 N Highland Ave
- 439 N Harvard Ave
- 125 S Chase Ave
- 316 E Highland Ave
- 131 N Chase Ave
- 1 S 215 Stratford Ln
- 212 W Kenilworth Ave
- 220 W Kenilworth Ave
- 224 W Kenilworth Ave
- 208 W Kenilworth Ave
- 228 W Kenilworth Ave
- 40 S Harvard Ave
- 232 W Kenilworth Ave
- 225 W Kenilworth Ave
- 236 W Kenilworth Ave
- 106 S Harvard Ave
- 37 S Harvard Ave
- 109 S Michigan Ave
- 240 W Kenilworth Ave
- 112 S Harvard Ave
- 15 S Michigan Ave
- 111 S Michigan Ave
- 146 W Kenilworth Ave
- 244 W Kenilworth Ave
- 116 S Harvard Ave
- 11 S Michigan Ave