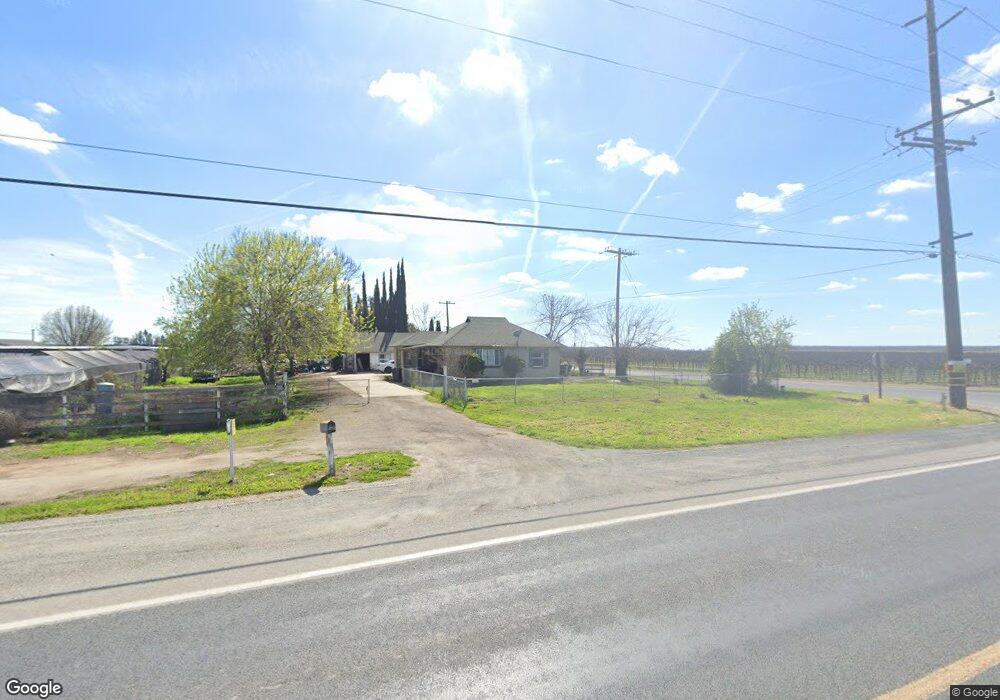
21611 Avenue 152 Porterville, CA 93257
Southwest Porterville NeighborhoodEstimated Value: $239,000 - $297,000
--
Bed
1
Bath
794
Sq Ft
$334/Sq Ft
Est. Value
About This Home
This home is located at 21611 Avenue 152, Porterville, CA 93257 and is currently estimated at $265,489, approximately $334 per square foot. 21611 Avenue 152 is a home located in Tulare County with nearby schools including Rockford Elementary School, Monache High School, and Strathmore High School.
Ownership History
Date
Name
Owned For
Owner Type
Purchase Details
Closed on
Aug 21, 2006
Sold by
Edgar Kathryn
Bought by
Edgar Kathryn and Edgar Byron D
Current Estimated Value
Home Financials for this Owner
Home Financials are based on the most recent Mortgage that was taken out on this home.
Original Mortgage
$80,000
Interest Rate
5.9%
Mortgage Type
New Conventional
Purchase Details
Closed on
Oct 30, 2003
Sold by
Edgar Chelsea
Bought by
Edgar Bennie and Edgar Kathryn
Purchase Details
Closed on
Dec 20, 2002
Sold by
Edgar Bennie
Bought by
Edgar Bennie and Edgar Kathryn
Purchase Details
Closed on
Dec 3, 2002
Sold by
Edgar Chelsea Lee
Bought by
Edgar Bennie and Edgar Kathryn
Purchase Details
Closed on
Mar 10, 1997
Sold by
Edgar Donna
Bought by
Edgar Byron and Edgar Bobby
Create a Home Valuation Report for This Property
The Home Valuation Report is an in-depth analysis detailing your home's value as well as a comparison with similar homes in the area
Home Values in the Area
Average Home Value in this Area
Purchase History
| Date | Buyer | Sale Price | Title Company |
|---|---|---|---|
| Edgar Kathryn | -- | First American Title Ins Co | |
| Edgar Bennie | $5,000 | -- | |
| Edgar Bennie | $5,000 | -- | |
| Edgar Bennie | -- | -- | |
| Edgar Bennie | -- | -- | |
| Edgar Byron | -- | Chicago Title Co | |
| Edgar Bennie | $62,500 | Chicago Title Co |
Source: Public Records
Mortgage History
| Date | Status | Borrower | Loan Amount |
|---|---|---|---|
| Closed | Edgar Kathryn | $80,000 |
Source: Public Records
Tax History Compared to Growth
Tax History
| Year | Tax Paid | Tax Assessment Tax Assessment Total Assessment is a certain percentage of the fair market value that is determined by local assessors to be the total taxable value of land and additions on the property. | Land | Improvement |
|---|---|---|---|---|
| 2025 | $4,036 | $187,422 | $44,698 | $142,724 |
| 2024 | $4,036 | $183,748 | $43,822 | $139,926 |
| 2023 | $4,036 | $180,146 | $42,963 | $137,183 |
| 2022 | $3,959 | $176,615 | $42,121 | $134,494 |
| 2021 | $3,936 | $173,152 | $41,295 | $131,857 |
| 2020 | $3,909 | $171,377 | $40,872 | $130,505 |
| 2019 | $3,862 | $168,017 | $40,071 | $127,946 |
| 2018 | $3,829 | $164,722 | $39,285 | $125,437 |
| 2017 | $3,800 | $161,492 | $38,515 | $122,977 |
| 2016 | $1,533 | $158,326 | $37,760 | $120,566 |
| 2015 | $1,474 | $155,948 | $37,193 | $118,755 |
| 2014 | $1,474 | $152,893 | $36,464 | $116,429 |
Source: Public Records
Map
Nearby Homes
- 249 S Westwood St
- 15478 Magnolia Rd
- 15247 Road 223
- 575 N Brandy Way
- 100 S Westwood St Unit 52
- 100 S Westwood St Unit 1
- 100 S Westwood St Unit 17
- 100 S Westwood St
- 100 S Westwood St Unit Lot 105
- 100 S Westwood St Unit 110
- 100 S Westwood St Unit Lot 71
- 100 S Westwood St Unit 128
- 100 S Westwood St Unit 92
- 100 S Westwood St Unit 20
- 2179 W Della Ave
- 2300 W Morton Ave Unit 163
- 2300 W Morton Ave Unit 22
- 2300 W Morton Ave Unit 135
- 226 S Argyle Place
- 313 Balmoral Dr
- 15142 Road 216
- 21663 Avenue 152
- 15114 Road 216
- 21691 Avenue 152
- 21011 Avenue 152
- 21715 Avenue 152
- 21649 Avenue 152
- 15035 Road 216
- 21797 Avenue 152
- 21797 W Ave 152 ( Olive)
- 18928 Avenue 152
- 14896 Road 216
- 14852 Road 216
- 22225 W Olive Ave
- 14818 Road 216
- 14794 Road 216
- 14794 SW 216 Rd
- 22019 Avenue 152
- 14754 Road 216
- 14742 Road 216