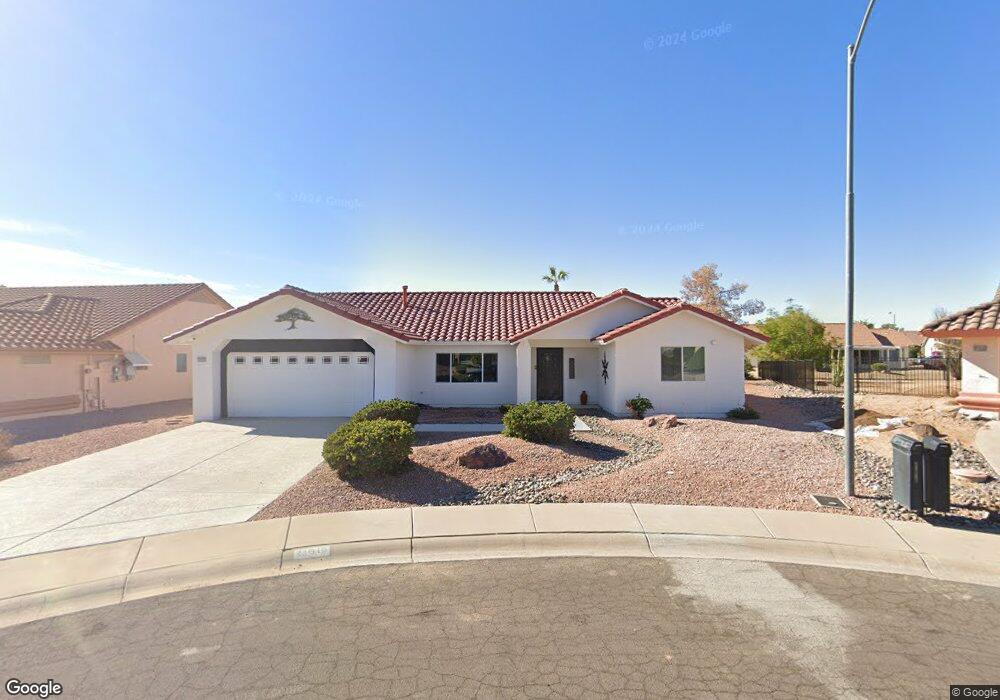
21616 N Yellowstone Ct Sun City West, AZ 85375
Estimated Value: $311,477 - $366,000
2
Beds
2
Baths
1,162
Sq Ft
$287/Sq Ft
Est. Value
About This Home
This home is located at 21616 N Yellowstone Ct, Sun City West, AZ 85375 and is currently estimated at $333,619, approximately $287 per square foot. 21616 N Yellowstone Ct is a home located in Maricopa County.
Ownership History
Date
Name
Owned For
Owner Type
Purchase Details
Closed on
Oct 30, 2024
Sold by
Cram Mark Douglas
Bought by
Cram Mark Douglas and Cram Macie L
Current Estimated Value
Purchase Details
Closed on
Jul 22, 2022
Sold by
Scott Cram Charles
Bought by
Cram Mark Douglas
Purchase Details
Closed on
Jun 28, 2022
Sold by
Sue Blackledge Denese
Bought by
Cram Mark Douglas
Purchase Details
Closed on
Mar 27, 2003
Sold by
Comstock Paul G and Franzmeir Edward
Bought by
Cram Chester L and Cram Glenna M
Purchase Details
Closed on
Oct 23, 2000
Sold by
Comstock Virgil
Bought by
Comstock Virgil V and The Virgil V Comstock Revocable Trust
Purchase Details
Closed on
Mar 15, 2000
Sold by
Klavetter Floyd L and Klavetter Elaine C
Bought by
Comstock Virgil
Purchase Details
Closed on
May 9, 1994
Sold by
Lapointe Wilfred T and Lapointe Lydia
Bought by
Klavetter Floyd L and Klavetter Elaine C
Create a Home Valuation Report for This Property
The Home Valuation Report is an in-depth analysis detailing your home's value as well as a comparison with similar homes in the area
Home Values in the Area
Average Home Value in this Area
Purchase History
| Date | Buyer | Sale Price | Title Company |
|---|---|---|---|
| Cram Mark Douglas | -- | None Listed On Document | |
| Cram Mark Douglas | -- | None Listed On Document | |
| Cram Mark Douglas | -- | None Listed On Document | |
| Cram Chester L | $121,000 | First American Title Ins Co | |
| Comstock Virgil V | -- | First American Title Ins Co | |
| Comstock Virgil | $119,000 | First American Title | |
| Klavetter Floyd L | $110,000 | First Service Title Agency |
Source: Public Records
Tax History Compared to Growth
Tax History
| Year | Tax Paid | Tax Assessment Tax Assessment Total Assessment is a certain percentage of the fair market value that is determined by local assessors to be the total taxable value of land and additions on the property. | Land | Improvement |
|---|---|---|---|---|
| 2025 | $1,604 | $19,954 | -- | -- |
| 2024 | $1,309 | $19,004 | -- | -- |
| 2023 | $1,309 | $26,110 | $5,220 | $20,890 |
| 2022 | $1,225 | $21,200 | $4,240 | $16,960 |
| 2021 | $879 | $19,300 | $3,860 | $15,440 |
| 2020 | $901 | $17,970 | $3,590 | $14,380 |
| 2019 | $926 | $15,860 | $3,170 | $12,690 |
| 2018 | $936 | $11,300 | $2,260 | $9,040 |
| 2017 | $946 | $11,300 | $2,260 | $9,040 |
| 2016 | $583 | $11,300 | $2,260 | $9,040 |
| 2015 | $958 | $11,300 | $2,260 | $9,040 |
Source: Public Records
Map
Nearby Homes
- 21606 N Yellowstone Cir
- 14307 W Whitewood Dr
- 21433 N 142nd Dr
- 14422 W Greystone Dr
- 14514 W Huron Dr
- 14518 W Heritage Dr
- 14102 W Whitewood Dr
- 14140 W Circle Ridge Dr
- 14105 W Sky Hawk Dr Unit 40
- 14623 W Greystone Dr
- 14123 W Circle Ridge Dr Unit 40
- 14111 W Circle Ridge Dr
- 14133 W Vía Montoya
- 21601 N 147th Dr
- 20854 N Gable Hill Dr
- 22009 N Vía de La Caballa
- 14010 W Pavillion Dr
- 22010 N Mirage Ln
- 14627 W Sky Hawk Dr
- 21807 N Veterans Dr
- 21612 N Yellowstone Cir
- 21620 N Yellowstone Cir
- 21620 N Yellowstone Ct
- 14416 W Yukon Dr
- 14412 W Yukon Dr
- 14420 W Yukon Dr
- 21608 N Yellowstone Cir
- 21608 N Yellowstone Ct
- 14408 W Yukon Dr
- 21623 N Yellowstone Cir
- 14424 W Yukon Dr
- 21611 N Yellowstone Ct
- 21615 N Yellowstone Ct
- 21611 N Yellowstone Cir
- 21607 N Yellowstone Ct
- 14404 W Yukon Dr
- 21619 N Yellowstone Cir
- 21604 N Yellowstone Ct
- 14428 W Yukon Dr Unit 44
- 21607 N Yellowstone Cir