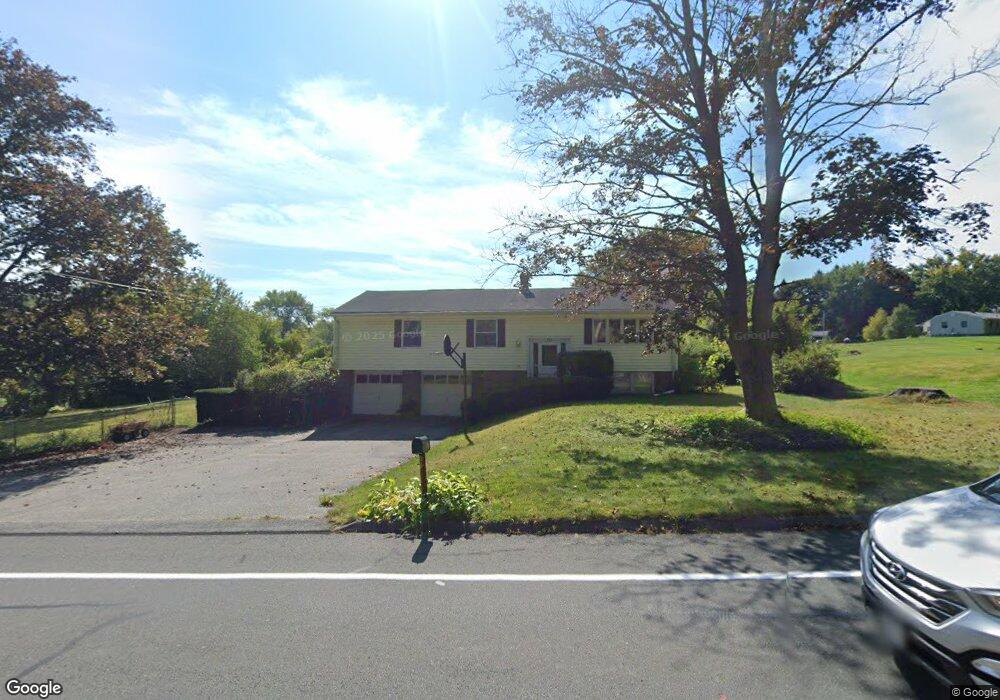
217 Morgan St South Hadley, MA 01075
Estimated Value: $358,000 - $465,000
4
Beds
3
Baths
1,620
Sq Ft
$256/Sq Ft
Est. Value
About This Home
This home is located at 217 Morgan St, South Hadley, MA 01075 and is currently estimated at $415,027, approximately $256 per square foot. 217 Morgan St is a home located in Hampshire County with nearby schools including Plains Elementary School, Mosier Elementary School, and Michael E. Smith Middle School.
Ownership History
Date
Name
Owned For
Owner Type
Purchase Details
Closed on
Dec 28, 1998
Sold by
Gagnon Maureen E and Gagnon Richard E
Bought by
Christie John C and Christie Margarita M
Current Estimated Value
Home Financials for this Owner
Home Financials are based on the most recent Mortgage that was taken out on this home.
Original Mortgage
$134,900
Interest Rate
6.89%
Mortgage Type
Purchase Money Mortgage
Create a Home Valuation Report for This Property
The Home Valuation Report is an in-depth analysis detailing your home's value as well as a comparison with similar homes in the area
Home Values in the Area
Average Home Value in this Area
Purchase History
| Date | Buyer | Sale Price | Title Company |
|---|---|---|---|
| Christie John C | $150,000 | -- |
Source: Public Records
Mortgage History
| Date | Status | Borrower | Loan Amount |
|---|---|---|---|
| Open | Christie John C | $108,000 | |
| Closed | Christie John C | $134,900 | |
| Previous Owner | Christie John C | $60,000 |
Source: Public Records
Tax History Compared to Growth
Tax History
| Year | Tax Paid | Tax Assessment Tax Assessment Total Assessment is a certain percentage of the fair market value that is determined by local assessors to be the total taxable value of land and additions on the property. | Land | Improvement |
|---|---|---|---|---|
| 2025 | $6,288 | $387,900 | $118,400 | $269,500 |
| 2024 | $6,084 | $366,700 | $110,500 | $256,200 |
| 2023 | $5,423 | $305,200 | $100,400 | $204,800 |
| 2022 | $5,288 | $278,600 | $100,400 | $178,200 |
| 2021 | $5,166 | $260,900 | $93,600 | $167,300 |
| 2020 | $5,085 | $250,000 | $93,600 | $156,400 |
| 2019 | $4,930 | $239,900 | $89,100 | $150,800 |
| 2018 | $4,776 | $233,900 | $86,400 | $147,500 |
| 2017 | $4,642 | $224,700 | $86,400 | $138,300 |
| 2016 | $4,594 | $224,200 | $86,400 | $137,800 |
| 2015 | $4,423 | $218,300 | $83,900 | $134,400 |
Source: Public Records
Map
Nearby Homes
- 289 Morgan St
- 31 College View Heights
- 121 Cold Hill Rd
- 200 East St
- 55 Pleasant St Unit 4
- 586 Granby Rd
- 3 Miller Ave
- 540 Granby Rd Unit 72A
- 540 Granby Rd Unit 109
- 540 Granby Rd Unit 62
- 540 Granby Rd Unit 2
- 96 College St
- 17 Woodbridge St
- 108 College St
- 73 Amherst St
- 41 Woodbridge St
- 19 Hadley St Unit E14
- 2 Pine Grove Dr
- 18 Smith Ave
- 34 Hildreth Ave