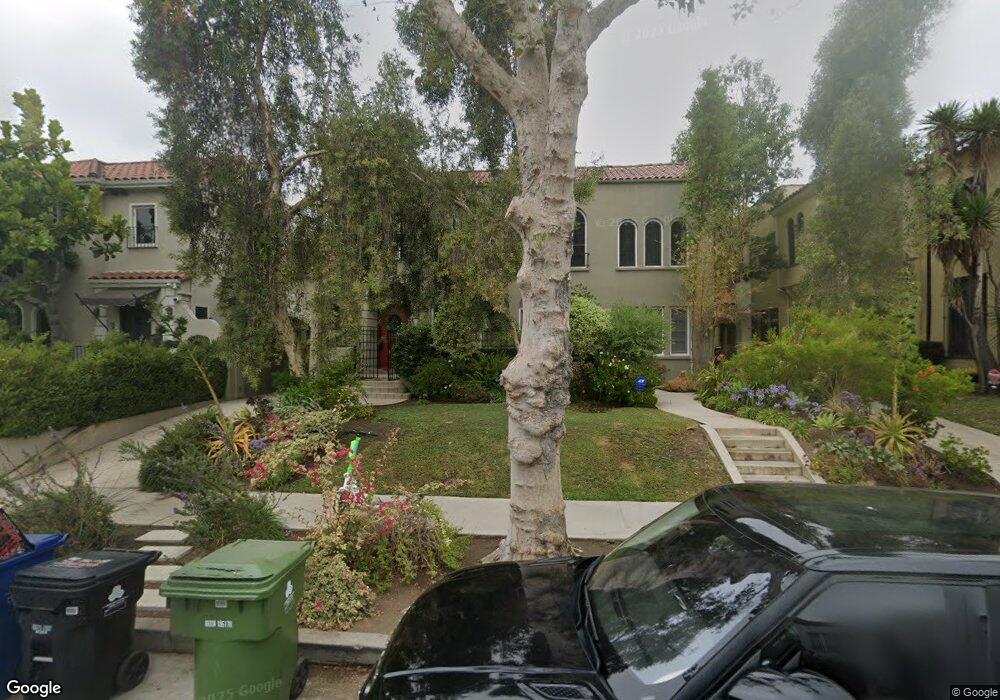
217 S Orange Dr Los Angeles, CA 90036
Hancock Park NeighborhoodEstimated Value: $2,485,000 - $3,291,000
6
Beds
4
Baths
4,616
Sq Ft
$621/Sq Ft
Est. Value
About This Home
This home is located at 217 S Orange Dr, Los Angeles, CA 90036 and is currently estimated at $2,867,641, approximately $621 per square foot. 217 S Orange Dr is a home located in Los Angeles County with nearby schools including Third Street Elementary School, John Burroughs Middle School, and Fairfax High School.
Ownership History
Date
Name
Owned For
Owner Type
Purchase Details
Closed on
Dec 28, 2017
Sold by
Clair David M St
Bought by
Roth Yoseph Y and Roth Rivkah
Current Estimated Value
Home Financials for this Owner
Home Financials are based on the most recent Mortgage that was taken out on this home.
Original Mortgage
$456,000
Outstanding Balance
$384,613
Interest Rate
3.92%
Mortgage Type
New Conventional
Estimated Equity
$2,483,028
Purchase Details
Closed on
Nov 2, 2016
Sold by
Bercovitz Freddie H
Bought by
St Clair David M
Home Financials for this Owner
Home Financials are based on the most recent Mortgage that was taken out on this home.
Original Mortgage
$421,000
Interest Rate
3.42%
Mortgage Type
New Conventional
Purchase Details
Closed on
Nov 4, 1996
Sold by
Whitson A Harold Living Trust
Bought by
Stclair David M
Home Financials for this Owner
Home Financials are based on the most recent Mortgage that was taken out on this home.
Original Mortgage
$408,000
Interest Rate
8.06%
Purchase Details
Closed on
Jul 17, 1996
Sold by
Whitson A Harold
Bought by
Whitson Arthur Harold
Create a Home Valuation Report for This Property
The Home Valuation Report is an in-depth analysis detailing your home's value as well as a comparison with similar homes in the area
Home Values in the Area
Average Home Value in this Area
Purchase History
| Date | Buyer | Sale Price | Title Company |
|---|---|---|---|
| Roth Yoseph Y | $2,250,000 | Lawyers Title La | |
| St Clair David M | -- | Title 365 | |
| Stclair David M | $510,000 | Guardian Title | |
| Whitson Arthur Harold | -- | -- |
Source: Public Records
Mortgage History
| Date | Status | Borrower | Loan Amount |
|---|---|---|---|
| Open | Roth Yoseph Y | $456,000 | |
| Previous Owner | St Clair David M | $421,000 | |
| Previous Owner | Stclair David M | $408,000 |
Source: Public Records
Tax History Compared to Growth
Tax History
| Year | Tax Paid | Tax Assessment Tax Assessment Total Assessment is a certain percentage of the fair market value that is determined by local assessors to be the total taxable value of land and additions on the property. | Land | Improvement |
|---|---|---|---|---|
| 2025 | $30,615 | $2,560,111 | $1,934,307 | $625,804 |
| 2024 | $30,615 | $2,509,914 | $1,896,380 | $613,534 |
| 2023 | $30,021 | $2,460,701 | $1,859,197 | $601,504 |
| 2022 | $28,623 | $2,412,453 | $1,822,743 | $589,710 |
| 2021 | $28,262 | $2,365,151 | $1,787,003 | $578,148 |
| 2019 | $27,412 | $2,295,000 | $1,734,000 | $561,000 |
| 2018 | $9,098 | $730,007 | $286,274 | $443,733 |
| 2016 | $8,661 | $701,661 | $275,158 | $426,503 |
| 2015 | $8,537 | $691,122 | $271,025 | $420,097 |
| 2014 | $8,573 | $677,584 | $265,716 | $411,868 |
Source: Public Records
Map
Nearby Homes
- 348 S Orange Dr
- 143 S Highland Ave
- 358 S Sycamore Ave
- 203 S Detroit St Unit 201
- 183 S Detroit St
- 119 S Highland Ave
- 109 N Sycamore Ave Unit 102
- 172 S Mccadden Place
- 120 N Orange Dr
- 452 S Sycamore Ave
- 143 N Sycamore Ave
- 601 S La Brea Ave
- 614 S Orange Dr
- 401 S Las Palmas Ave
- 160 S Poinsettia Place
- 147 N Detroit St
- 609 S Highland Ave
- 191 S Hudson Ave
- 157 N Las Palmas Ave
- 228 S Hudson Ave
- 211 S Orange Dr
- 223 S Orange Dr
- 229 S Orange Dr Unit 10
- 229 S Orange Dr
- 231 S Orange Dr
- 218 S Sycamore Ave
- 224 S Sycamore Ave
- 235 S Orange Dr
- 222 S Sycamore Ave
- 203 S Orange Dr
- 200 S Sycamore Ave
- 200 S Sycamore Ave Unit 6
- 200 S Sycamore Ave Unit 5
- 200 S Sycamore Ave
- 218 S Orange Dr
- 230 S Sycamore Ave
- 224 S Orange Dr
- 216 S Orange Dr
- 222 S Orange Dr Unit 222
- 222 S Orange Dr