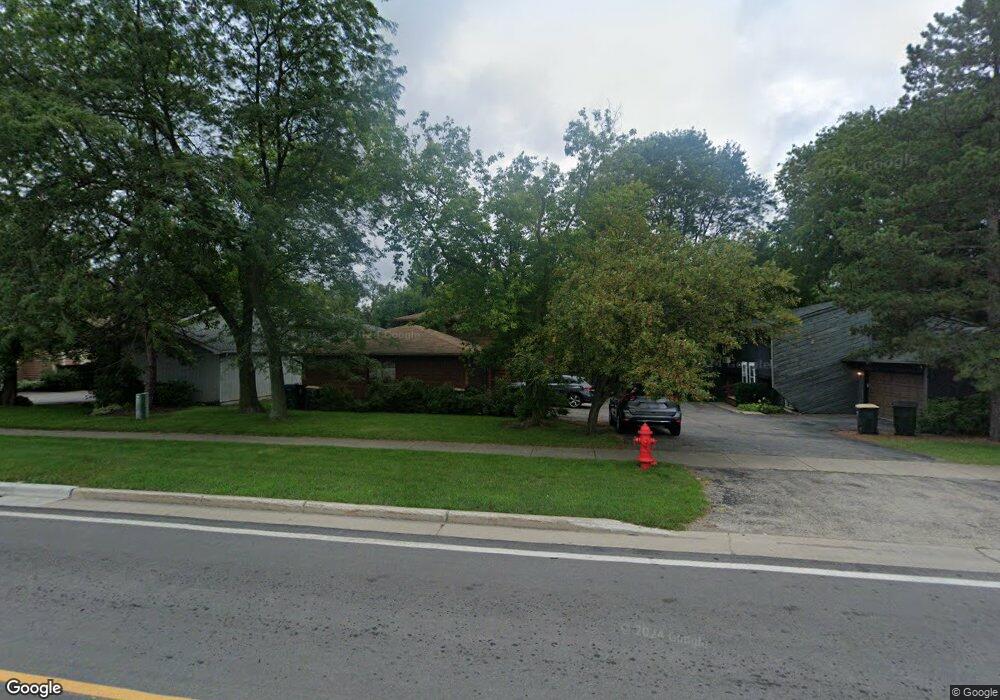
217 W Winchester Rd Libertyville, IL 60048
Estimated Value: $391,468 - $471,000
--
Bed
2
Baths
1,196
Sq Ft
$363/Sq Ft
Est. Value
About This Home
This home is located at 217 W Winchester Rd, Libertyville, IL 60048 and is currently estimated at $434,117, approximately $362 per square foot. 217 W Winchester Rd is a home located in Lake County with nearby schools including Adler Park School, Highland Middle School, and Libertyville High School.
Ownership History
Date
Name
Owned For
Owner Type
Purchase Details
Closed on
Oct 10, 2008
Sold by
Chicago Title Land Trust Co
Bought by
Regency Homes & Development Co
Current Estimated Value
Purchase Details
Closed on
Oct 30, 2006
Sold by
J & J Greenleaf Townhomes Inc
Bought by
Norstates Bank and Trust #204145
Purchase Details
Closed on
Oct 26, 2006
Sold by
Norstates Bank
Bought by
J & J Greenleaf Townhomes Inc
Purchase Details
Closed on
Apr 21, 2004
Sold by
Parikh Kernel and Gardi Dr Rashmikant
Bought by
Bank Of Waukegan and Trust #204502
Purchase Details
Closed on
Nov 17, 1993
Sold by
Bank Of Waukegan
Bought by
Parikh Kernel P and Shah Arvind
Home Financials for this Owner
Home Financials are based on the most recent Mortgage that was taken out on this home.
Original Mortgage
$110,000
Interest Rate
6.25%
Create a Home Valuation Report for This Property
The Home Valuation Report is an in-depth analysis detailing your home's value as well as a comparison with similar homes in the area
Home Values in the Area
Average Home Value in this Area
Purchase History
| Date | Buyer | Sale Price | Title Company |
|---|---|---|---|
| Regency Homes & Development Co | -- | None Available | |
| Norstates Bank | $500,000 | Ticor | |
| J & J Greenleaf Townhomes Inc | $500,000 | Ticor | |
| Bank Of Waukegan | -- | -- | |
| Parikh Kernel P | -- | -- |
Source: Public Records
Mortgage History
| Date | Status | Borrower | Loan Amount |
|---|---|---|---|
| Previous Owner | Parikh Kernel P | $110,000 |
Source: Public Records
Tax History Compared to Growth
Tax History
| Year | Tax Paid | Tax Assessment Tax Assessment Total Assessment is a certain percentage of the fair market value that is determined by local assessors to be the total taxable value of land and additions on the property. | Land | Improvement |
|---|---|---|---|---|
| 2024 | $8,796 | $118,413 | $53,708 | $64,705 |
| 2023 | $8,487 | $109,217 | $49,537 | $59,680 |
| 2022 | $8,487 | $106,124 | $47,613 | $58,511 |
| 2021 | $8,178 | $103,839 | $46,588 | $57,251 |
| 2020 | $7,876 | $102,093 | $45,805 | $56,288 |
| 2019 | $7,679 | $101,122 | $45,369 | $55,753 |
| 2018 | $7,880 | $107,213 | $52,586 | $54,627 |
| 2017 | $7,775 | $103,828 | $50,926 | $52,902 |
| 2016 | $7,534 | $98,443 | $48,285 | $50,158 |
| 2015 | $7,487 | $92,011 | $45,130 | $46,881 |
| 2014 | $6,555 | $78,937 | $38,717 | $40,220 |
| 2012 | $5,999 | $79,622 | $39,053 | $40,569 |
Source: Public Records
Map
Nearby Homes
- 212 W Ellis Ave
- 208 W Ellis Ave
- 204 W Ellis Ave
- 619 Parkside Ct
- 616 Parkside Ct
- 922 N Milwaukee Ave Unit A
- 662 Parkside Ct
- 694 Parkside Ct
- 1211 Parliament Ct
- 505 Lange Ct
- 420 W Cook Ave
- 224 Newberry Ave
- 212 Elm Ct
- 31132-31140 N Milwaukee Ave
- 217 E Church St
- 551 W Park Ave Unit E
- 308 Mckinley Ave
- 832 Interlaken Ln
- 601 Broadway St
- 1754 Glenmore Rd
- 213 W Winchester Rd
- 221 W Winchester Rd
- 209 W Winchester Rd
- 225 W Winchester Rd
- 220 W Ellis Ave
- 222 W Ellis Ave
- 205 W Winchester Rd
- 216 W Ellis Ave
- 224 W Ellis Ave
- 201 W Winchester Rd
- 214 W Ellis Ave
- 123 W Winchester Rd
- 0 W Ellis Ave
- Lot 21 W Ellis Ave
- Lot 22 W Ellis Ave
- 208 W Ellis Ave
- 208 W Ellis Ave
- 375 W Winchester Rd Unit 312
- 375 W Winchester Rd Unit 311
- 375 W Winchester Rd Unit 310