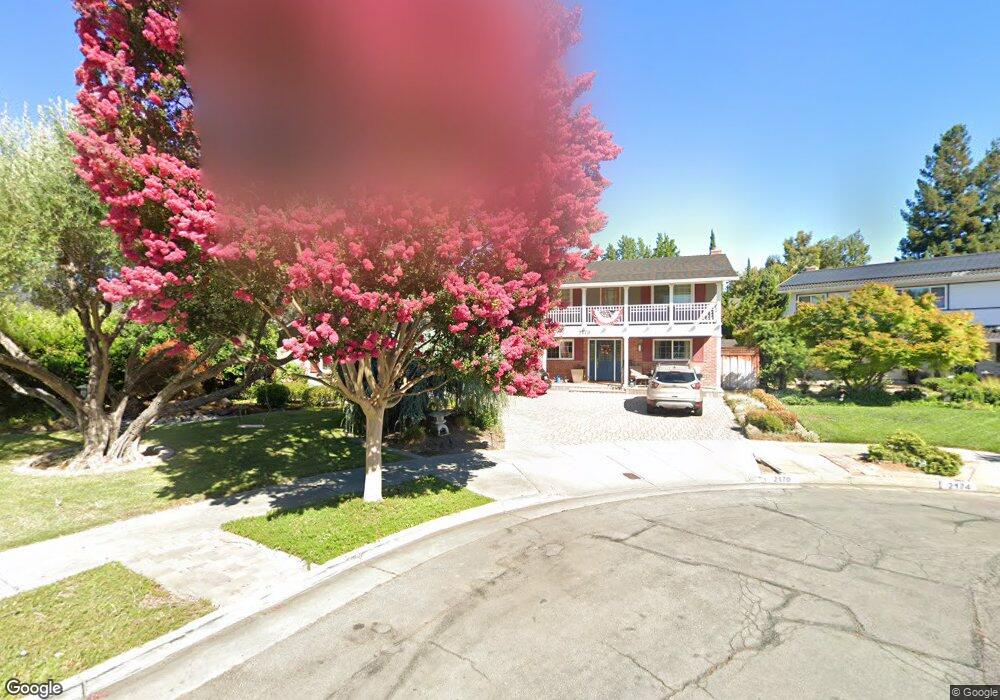
2170 Westmoreland Dr San Jose, CA 95124
Willow Glen NeighborhoodEstimated Value: $2,679,000 - $3,116,000
6
Beds
3
Baths
2,810
Sq Ft
$1,007/Sq Ft
Est. Value
About This Home
This home is located at 2170 Westmoreland Dr, San Jose, CA 95124 and is currently estimated at $2,830,969, approximately $1,007 per square foot. 2170 Westmoreland Dr is a home located in Santa Clara County with nearby schools including Bagby Elementary School, Branham High School, and Fammatre Elementary School.
Ownership History
Date
Name
Owned For
Owner Type
Purchase Details
Closed on
Jul 8, 2010
Sold by
Guinnane Anthony and Guinnane Elizabeth
Bought by
Guinnane Anthony and Guinnane Elizabeth A
Current Estimated Value
Home Financials for this Owner
Home Financials are based on the most recent Mortgage that was taken out on this home.
Original Mortgage
$665,500
Outstanding Balance
$443,117
Interest Rate
4.76%
Mortgage Type
New Conventional
Estimated Equity
$2,387,852
Purchase Details
Closed on
Jun 25, 2008
Sold by
Guinnane Anthony and Guinnane Elizabeth
Bought by
Giannane Anthony and Guinnane Elizabeth A
Purchase Details
Closed on
Jul 30, 1998
Sold by
Thomas Thomas J and Thomas Jean A
Bought by
Guinnane Anthony and Guinnane Elizabeth
Home Financials for this Owner
Home Financials are based on the most recent Mortgage that was taken out on this home.
Original Mortgage
$516,000
Interest Rate
4.75%
Create a Home Valuation Report for This Property
The Home Valuation Report is an in-depth analysis detailing your home's value as well as a comparison with similar homes in the area
Home Values in the Area
Average Home Value in this Area
Purchase History
| Date | Buyer | Sale Price | Title Company |
|---|---|---|---|
| Guinnane Anthony | -- | First American Title Company | |
| Guinnane Anthony | -- | First American Title Company | |
| Giannane Anthony | -- | None Available | |
| Guinnane Anthony | $645,000 | Old Republic Title Company |
Source: Public Records
Mortgage History
| Date | Status | Borrower | Loan Amount |
|---|---|---|---|
| Open | Guinnane Anthony | $665,500 | |
| Closed | Guinnane Anthony | $516,000 |
Source: Public Records
Tax History Compared to Growth
Tax History
| Year | Tax Paid | Tax Assessment Tax Assessment Total Assessment is a certain percentage of the fair market value that is determined by local assessors to be the total taxable value of land and additions on the property. | Land | Improvement |
|---|---|---|---|---|
| 2025 | $13,553 | $1,011,160 | $470,304 | $540,856 |
| 2024 | $13,553 | $991,334 | $461,083 | $530,251 |
| 2023 | $13,461 | $971,897 | $452,043 | $519,854 |
| 2022 | $13,221 | $952,841 | $443,180 | $509,661 |
| 2021 | $12,964 | $934,159 | $434,491 | $499,668 |
| 2020 | $12,376 | $924,581 | $430,036 | $494,545 |
| 2019 | $12,226 | $906,453 | $421,604 | $484,849 |
| 2018 | $11,891 | $888,681 | $413,338 | $475,343 |
| 2017 | $11,675 | $871,257 | $405,234 | $466,023 |
| 2016 | $11,120 | $854,175 | $397,289 | $456,886 |
| 2015 | $10,988 | $841,346 | $391,322 | $450,024 |
| 2014 | $10,390 | $824,866 | $383,657 | $441,209 |
Source: Public Records
Map
Nearby Homes
- 1500 E Campbell Ave
- 1829 Cabana Dr
- 1870 Patio Dr
- 1791 Frobisher Way
- 2322 Meridian Ave
- 1831 Frobisher Way
- 2538 Custer Dr
- 1736 Frobisher Way
- 2498 Raleigh Dr
- 1898 Meridian Ave Unit 29
- 2514 Meridian Ave
- 1741 Harte Dr
- 1705 Harte Dr
- 1959 Schrader Dr
- 2425 Briarwood Dr
- 866 Apricot Ave Unit C
- 2536 Malaga Dr
- 2772 Quinto Way
- 1759 Willowhurst Ave
- 2020 James Place
- 2166 Westmoreland Dr
- 2174 Westmoreland Dr
- 1862 Kirkmont Dr
- 1856 Kirkmont Dr
- 1866 Kirkmont Dr
- 2178 Westmoreland Dr
- 2162 Westmoreland Dr
- 2182 Westmoreland Dr
- 1848 Kirkmont Dr
- 2189 Westmoreland Dr
- 1870 Kirkmont Dr
- 2186 Westmoreland Dr
- 1844 Kirkmont Dr
- 2163 Westmoreland Dr
- 2161 Northampton Dr
- 2163 Northampton Dr
- 2193 Westmoreland Dr
- 1878 Kirkmont Dr
- 1859 Kirkmont Dr
- 1838 Kirkmont Dr