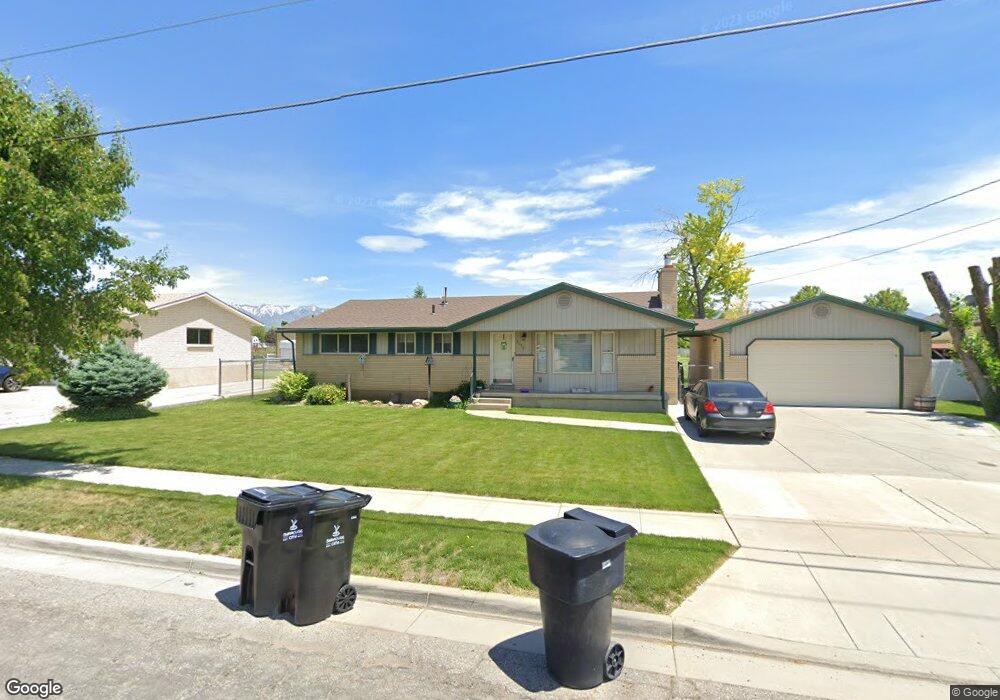
2175 S 1000 W Syracuse, UT 84075
Estimated Value: $484,000 - $515,596
4
Beds
3
Baths
2,662
Sq Ft
$188/Sq Ft
Est. Value
About This Home
This home is located at 2175 S 1000 W, Syracuse, UT 84075 and is currently estimated at $501,149, approximately $188 per square foot. 2175 S 1000 W is a home located in Davis County with nearby schools including Bluff Ridge Elementary, Legacy Junior High School, and Clearfield High School.
Ownership History
Date
Name
Owned For
Owner Type
Purchase Details
Closed on
Mar 5, 2020
Sold by
Chambers Jeremy J and Chambers Linzy Dawn
Bought by
Record Andrew David
Current Estimated Value
Home Financials for this Owner
Home Financials are based on the most recent Mortgage that was taken out on this home.
Original Mortgage
$284,747
Outstanding Balance
$260,369
Interest Rate
5.5%
Mortgage Type
FHA
Estimated Equity
$240,780
Purchase Details
Closed on
Jun 22, 2017
Sold by
Chambers Jeremy J
Bought by
Chambers Jeremy J and Gutierrez Linzy Dawn
Home Financials for this Owner
Home Financials are based on the most recent Mortgage that was taken out on this home.
Original Mortgage
$217,979
Interest Rate
4.62%
Mortgage Type
FHA
Purchase Details
Closed on
Jan 19, 2005
Sold by
Thurgood Lois
Bought by
Thurgood Lois J
Purchase Details
Closed on
Jun 18, 2003
Sold by
Parry Bruce G and Parry Darlene S
Bought by
Thurgood Duane and Thurgood Lois
Create a Home Valuation Report for This Property
The Home Valuation Report is an in-depth analysis detailing your home's value as well as a comparison with similar homes in the area
Home Values in the Area
Average Home Value in this Area
Purchase History
| Date | Buyer | Sale Price | Title Company |
|---|---|---|---|
| Record Andrew David | -- | Backman Title Service | |
| Chambers Jeremy J | -- | Real Advantage Title | |
| Chambers Jeremy J | -- | Real Advantage Title | |
| Thurgood Lois J | -- | -- | |
| Thurgood Duane | -- | Heritage West Title Insuranc |
Source: Public Records
Mortgage History
| Date | Status | Borrower | Loan Amount |
|---|---|---|---|
| Open | Record Andrew David | $284,747 | |
| Previous Owner | Chambers Jeremy J | $217,979 |
Source: Public Records
Tax History Compared to Growth
Tax History
| Year | Tax Paid | Tax Assessment Tax Assessment Total Assessment is a certain percentage of the fair market value that is determined by local assessors to be the total taxable value of land and additions on the property. | Land | Improvement |
|---|---|---|---|---|
| 2025 | $2,543 | $245,300 | $126,251 | $119,049 |
| 2024 | $2,537 | $246,400 | $105,654 | $140,746 |
| 2023 | $2,379 | $421,000 | $147,145 | $273,855 |
| 2022 | $2,568 | $249,150 | $84,532 | $164,618 |
| 2021 | $2,270 | $341,000 | $125,060 | $215,940 |
| 2020 | $2,056 | $299,000 | $108,320 | $190,680 |
| 2019 | $1,839 | $264,000 | $106,638 | $157,362 |
| 2018 | $1,530 | $218,000 | $102,580 | $115,420 |
| 2016 | $1,370 | $102,355 | $39,345 | $63,010 |
| 2015 | $1,332 | $94,765 | $39,345 | $55,420 |
| 2014 | $1,387 | $100,566 | $39,345 | $61,221 |
| 2013 | -- | $81,927 | $36,414 | $45,513 |
Source: Public Records
Map
Nearby Homes