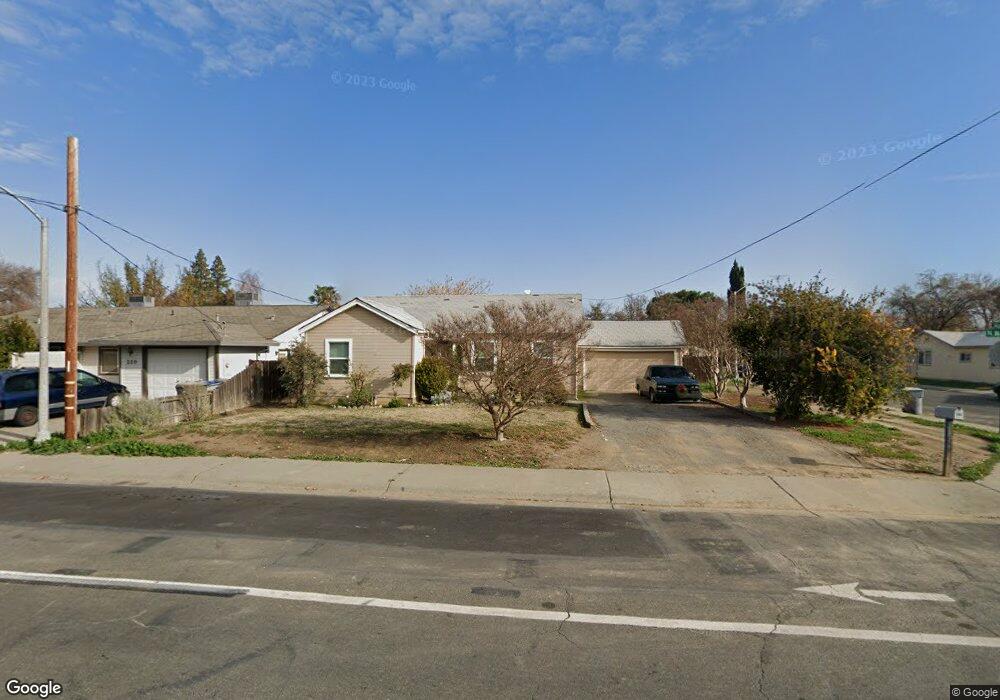
218 N Walnut St Woodland, CA 95695
Estimated Value: $324,000 - $442,000
2
Beds
1
Bath
1,045
Sq Ft
$359/Sq Ft
Est. Value
About This Home
This home is located at 218 N Walnut St, Woodland, CA 95695 and is currently estimated at $374,669, approximately $358 per square foot. 218 N Walnut St is a home located in Yolo County with nearby schools including Freeman Elementary School, Lee Middle School, and Woodland Senior High School.
Ownership History
Date
Name
Owned For
Owner Type
Purchase Details
Closed on
May 6, 2020
Sold by
Frommelt Thomas J
Bought by
Frommelt Thomas J and The Thomas J Frommelt Living T
Current Estimated Value
Purchase Details
Closed on
Jul 27, 2017
Sold by
Frommelt Robert and Frommelt Susan
Bought by
Frommelt Robert and Frommelt Susan
Purchase Details
Closed on
Dec 30, 1996
Sold by
Frommelt Robert G and Frommelt Jill
Bought by
Frommelt Thomas J
Home Financials for this Owner
Home Financials are based on the most recent Mortgage that was taken out on this home.
Original Mortgage
$20,000
Interest Rate
6.82%
Mortgage Type
Seller Take Back
Create a Home Valuation Report for This Property
The Home Valuation Report is an in-depth analysis detailing your home's value as well as a comparison with similar homes in the area
Home Values in the Area
Average Home Value in this Area
Purchase History
| Date | Buyer | Sale Price | Title Company |
|---|---|---|---|
| Frommelt Thomas J | -- | None Available | |
| Frommelt Robert | -- | None Available | |
| Frommelt Robert | -- | None Available | |
| Frommelt Thomas J | $30,000 | First American Title Ins Co | |
| Frommelt Bob | $20,000 | First American Title Ins Co | |
| Frommelt Bob | -- | First American Title Ins Co | |
| Frommelt Sue | -- | First American Title Ins Co | |
| Frommelt Thomas J | -- | First American Title Ins Co | |
| Frommelt Thomas J | -- | First American Title Ins Co |
Source: Public Records
Mortgage History
| Date | Status | Borrower | Loan Amount |
|---|---|---|---|
| Previous Owner | Frommelt Bob | $20,000 | |
| Previous Owner | Frommelt Thomas J | $30,000 |
Source: Public Records
Tax History Compared to Growth
Tax History
| Year | Tax Paid | Tax Assessment Tax Assessment Total Assessment is a certain percentage of the fair market value that is determined by local assessors to be the total taxable value of land and additions on the property. | Land | Improvement |
|---|---|---|---|---|
| 2025 | $1,745 | $169,288 | $78,374 | $90,914 |
| 2023 | $1,745 | $162,717 | $75,332 | $87,385 |
| 2022 | $1,677 | $159,527 | $73,855 | $85,672 |
| 2021 | $1,650 | $156,400 | $72,407 | $83,993 |
| 2020 | $1,627 | $154,797 | $71,665 | $83,132 |
| 2019 | $1,596 | $151,762 | $70,260 | $81,502 |
| 2018 | $1,580 | $148,787 | $68,883 | $79,904 |
| 2017 | $1,546 | $145,871 | $67,533 | $78,338 |
| 2016 | $1,519 | $143,011 | $66,209 | $76,802 |
| 2015 | $1,469 | $140,864 | $65,215 | $75,649 |
| 2014 | $1,469 | $138,106 | $63,938 | $74,168 |
Source: Public Records
Map
Nearby Homes
- 220 N Walnut St
- 217 Hanna Way
- 219 Hilda Way
- 222 N Walnut St
- 221 Hilda Way
- 210 N Walnut St
- 223 Hilda Way
- 226 N Walnut St
- 225 Hilda Way
- 215 N Walnut St
- 202 N Walnut St
- 207 Woodland Ave
- 217 N Walnut St
- 230 N Walnut St
- 218 Hilda Way
- 216 Hanna Way
- 211 Woodland Ave
- 222 Hilda Way
- 227 Hilda Way
- 211 N Walnut St