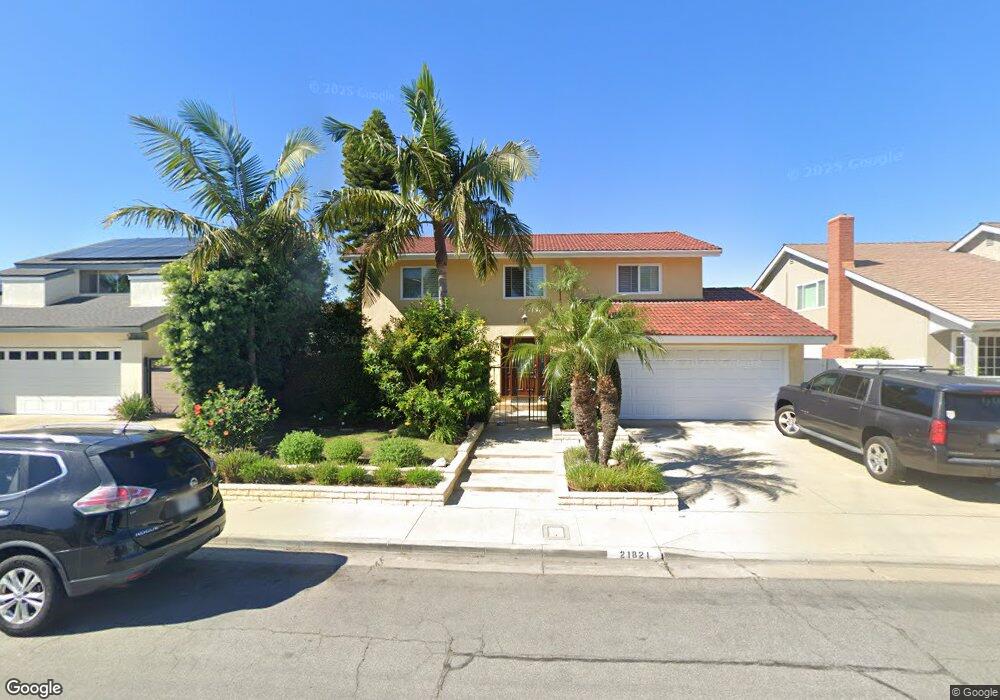
21821 Windsong Cir Huntington Beach, CA 92646
Southeast NeighborhoodEstimated Value: $1,800,000 - $1,972,332
4
Beds
3
Baths
2,413
Sq Ft
$792/Sq Ft
Est. Value
About This Home
This home is located at 21821 Windsong Cir, Huntington Beach, CA 92646 and is currently estimated at $1,910,333, approximately $791 per square foot. 21821 Windsong Cir is a home located in Orange County with nearby schools including John H. Eader Elementary School, Isaac L. Sowers Middle School, and Edison High School.
Ownership History
Date
Name
Owned For
Owner Type
Purchase Details
Closed on
Oct 20, 2005
Sold by
Seymour Derek and Seymour Kirstin
Bought by
Carlson Keith W and Carlson Amy T
Current Estimated Value
Home Financials for this Owner
Home Financials are based on the most recent Mortgage that was taken out on this home.
Original Mortgage
$820,000
Outstanding Balance
$435,022
Interest Rate
5.62%
Mortgage Type
New Conventional
Estimated Equity
$1,475,311
Purchase Details
Closed on
Feb 2, 2000
Sold by
Higgins Kurtis P and Higgins Erin P
Bought by
Seymour Derek and Seymour Kirstin
Home Financials for this Owner
Home Financials are based on the most recent Mortgage that was taken out on this home.
Original Mortgage
$332,800
Interest Rate
8%
Purchase Details
Closed on
Jul 21, 1997
Sold by
Francis Haney James and Francis Teiko F
Bought by
Higgins Kurtis Patrick and Higgins Erin Patricia
Home Financials for this Owner
Home Financials are based on the most recent Mortgage that was taken out on this home.
Original Mortgage
$271,200
Interest Rate
3.95%
Create a Home Valuation Report for This Property
The Home Valuation Report is an in-depth analysis detailing your home's value as well as a comparison with similar homes in the area
Home Values in the Area
Average Home Value in this Area
Purchase History
| Date | Buyer | Sale Price | Title Company |
|---|---|---|---|
| Carlson Keith W | $1,025,000 | First Southwestern Title Co | |
| Seymour Derek | $416,000 | Chicago Title Co | |
| Higgins Kurtis Patrick | $339,000 | Old Republic Title Company |
Source: Public Records
Mortgage History
| Date | Status | Borrower | Loan Amount |
|---|---|---|---|
| Open | Carlson Keith W | $820,000 | |
| Previous Owner | Seymour Derek | $332,800 | |
| Previous Owner | Higgins Kurtis Patrick | $271,200 | |
| Closed | Seymour Derek | $41,600 |
Source: Public Records
Tax History Compared to Growth
Tax History
| Year | Tax Paid | Tax Assessment Tax Assessment Total Assessment is a certain percentage of the fair market value that is determined by local assessors to be the total taxable value of land and additions on the property. | Land | Improvement |
|---|---|---|---|---|
| 2025 | $15,899 | $1,441,709 | $1,194,786 | $246,923 |
| 2024 | $15,899 | $1,413,441 | $1,171,359 | $242,082 |
| 2023 | $12,719 | $1,128,749 | $925,659 | $203,090 |
| 2022 | $12,386 | $1,106,617 | $907,509 | $199,108 |
| 2021 | $11,734 | $1,046,520 | $889,715 | $156,805 |
| 2020 | $11,776 | $1,046,520 | $889,715 | $156,805 |
| 2019 | $11,633 | $1,026,000 | $872,269 | $153,731 |
| 2018 | $10,664 | $935,000 | $781,269 | $153,731 |
| 2017 | $10,727 | $935,000 | $781,269 | $153,731 |
| 2016 | $10,444 | $935,000 | $781,269 | $153,731 |
| 2015 | $9,842 | $875,000 | $721,269 | $153,731 |
| 2014 | $9,287 | $826,000 | $672,269 | $153,731 |
Source: Public Records
Map
Nearby Homes
- 21861 Vacation Ln
- 21722 Hilaria Cir
- 21941 Oceanview Ln
- 22102 Wood Island Ln
- 21662 Brookhurst St Unit D
- 21382 Lemontree Ln
- 21361 Lemontree Ln
- 9552 Castine Dr
- 21621 Kaneohe Ln
- 9581 Chevy Chase Dr
- 9171 Regatta Dr
- 9802 Effingham Dr
- 9112 Playa Dr
- 9121 Christine Dr
- 1170 Gleneagles Terrace
- 9021 Niguel Cir
- 1269 Westreef
- 21221 Hillsdale Ln
- 1 Starfish Ct Unit 40
- 5 Sand Dollar Ct Unit 16
- 21801 Windsong Cir
- 21831 Windsong Cir
- 21822 Seaside Ln
- 21791 Windsong Cir
- 21832 Seaside Ln
- 21802 Seaside Ln
- 21841 Windsong Cir
- 21822 Windsong Cir
- 21842 Seaside Ln
- 21832 Windsong Cir
- 21802 Windsong Cir
- 21792 Seaside Ln
- 21781 Windsong Cir
- 21792 Windsong Cir
- 21842 Windsong Cir
- 21782 Seaside Ln
- 21782 Windsong Cir
- 21771 Windsong Cir
- 21821 Seaside Ln
- 9642 Surfcrest Dr