
Last list price
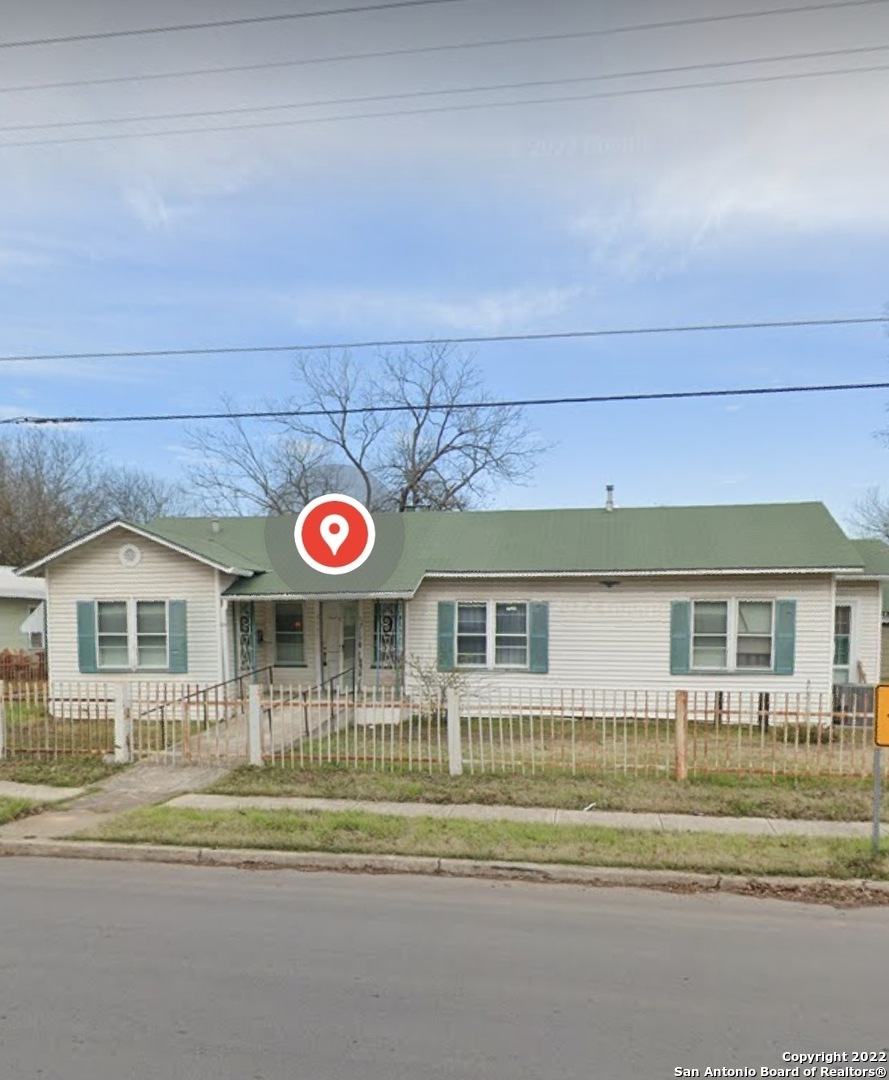
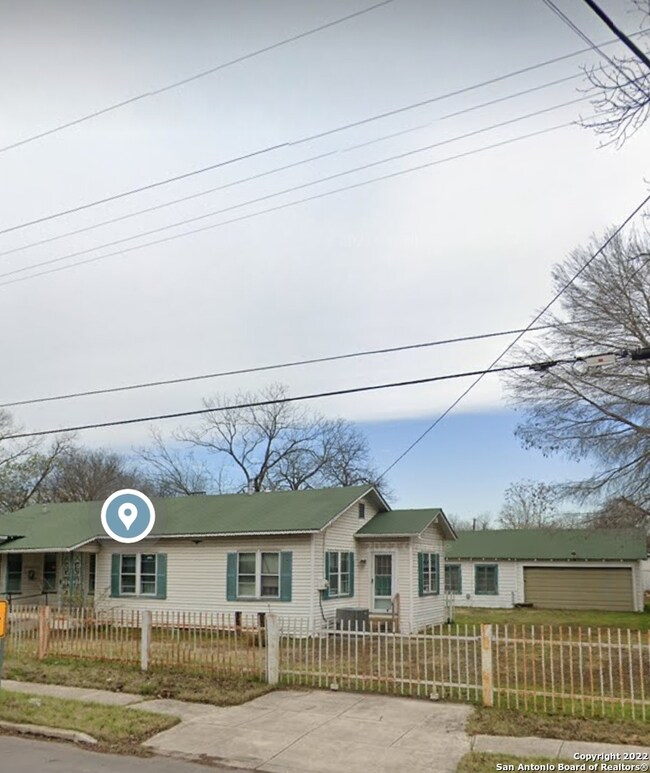
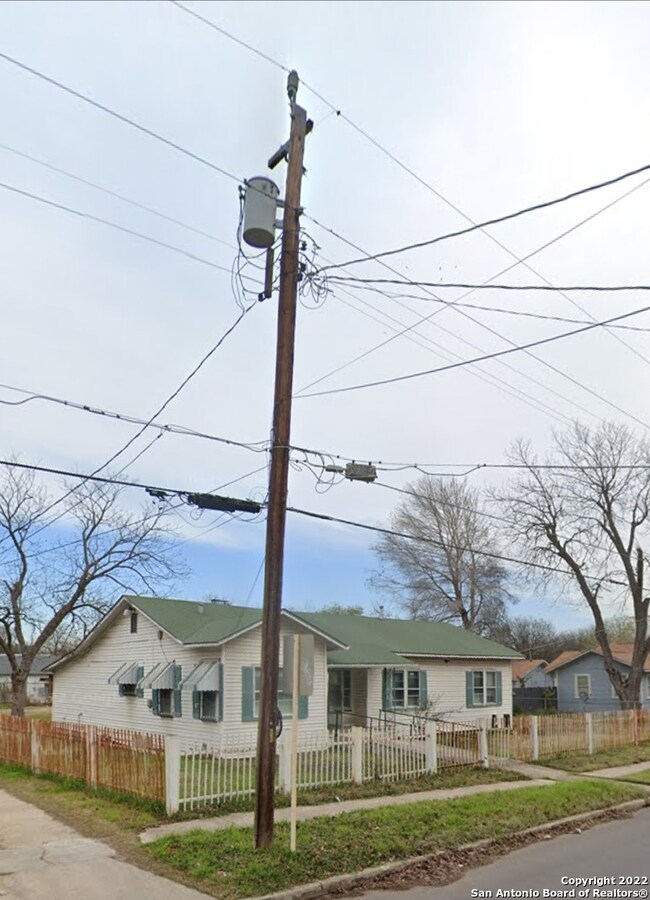
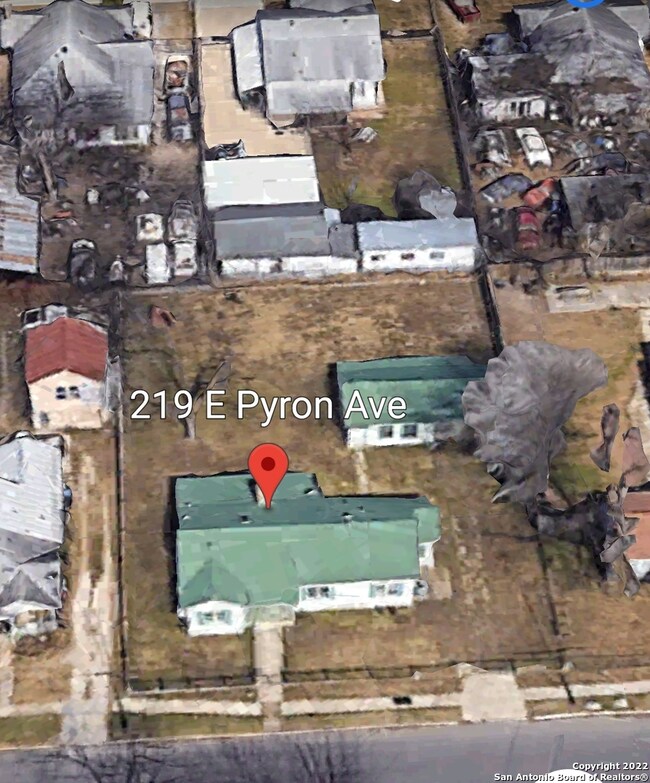
219 E Pyron Ave San Antonio, TX 78214
Riverside Neighborhood
3
Beds
2
Baths
1,368
Sq Ft
0.33
Acres
Highlights
- Central Heating and Cooling System
- Ceiling Fan
- Carpet
About This Home
As of August 2022Selling as is, needs TLC, needs water heater, needs new flooring and paint.
Home Details
Home Type
- Single Family
Est. Annual Taxes
- $5,285
Year Built
- Built in 1946
Parking
- 2 Car Garage
Home Design
- Slab Foundation
Interior Spaces
- 1,368 Sq Ft Home
- Property has 1 Level
- Ceiling Fan
- Window Treatments
- Carpet
- Washer Hookup
Bedrooms and Bathrooms
- 3 Bedrooms
- 2 Full Bathrooms
Additional Features
- 0.33 Acre Lot
- Central Heating and Cooling System
Community Details
- Harlandale Subdivision
Listing and Financial Details
- Legal Lot and Block 11 / 20
- Assessor Parcel Number 076860200110
Ownership History
Date
Name
Owned For
Owner Type
Purchase Details
Closed on
Jun 26, 2025
Sold by
Rodriguez Jose A and Rodriguez Maria Natividad
Bought by
Juangorena Rolando and Mendez Priscilla M
Home Financials for this Owner
Home Financials are based on the most recent Mortgage that was taken out on this home.
Original Mortgage
$216,015
Outstanding Balance
$216,015
Interest Rate
6.86%
Mortgage Type
FHA
Estimated Equity
-$5,273
Purchase Details
Listed on
Aug 7, 2022
Closed on
Jun 15, 2022
Sold by
Martha Salas
Bought by
Rodriguez Jose A
Seller's Agent
Vince Salas
Texas Home Realty
Buyer's Agent
Vince Salas
Texas Home Realty
List Price
$185,000
Sold Price
$181,500
Premium/Discount to List
-$3,500
-1.89%
Home Financials for this Owner
Home Financials are based on the most recent Mortgage that was taken out on this home.
Avg. Annual Appreciation
5.23%
Original Mortgage
$148,000
Interest Rate
5.27%
Mortgage Type
New Conventional
Purchase Details
Closed on
Apr 20, 2011
Sold by
Sanchez Juanita E
Bought by
Sanchez Irene E
Similar Homes in San Antonio, TX
Create a Home Valuation Report for This Property
The Home Valuation Report is an in-depth analysis detailing your home's value as well as a comparison with similar homes in the area
Home Values in the Area
Average Home Value in this Area
Purchase History
| Date | Type | Sale Price | Title Company |
|---|---|---|---|
| Deed | -- | None Listed On Document | |
| Deed | -- | None Listed On Document | |
| Interfamily Deed Transfer | -- | Itc |
Source: Public Records
Mortgage History
| Date | Status | Loan Amount | Loan Type |
|---|---|---|---|
| Open | $216,015 | FHA | |
| Previous Owner | $148,000 | New Conventional | |
| Previous Owner | $148,500 | Reverse Mortgage Home Equity Conversion Mortgage | |
| Previous Owner | $6,666 | Construction |
Source: Public Records
Property History
| Date | Event | Price | Change | Sq Ft Price |
|---|---|---|---|---|
| 01/02/2025 01/02/25 | Price Changed | $225,000 | -1.1% | $133 / Sq Ft |
| 12/21/2024 12/21/24 | Price Changed | $227,500 | -1.0% | $135 / Sq Ft |
| 12/15/2024 12/15/24 | Price Changed | $229,900 | 0.0% | $136 / Sq Ft |
| 12/11/2024 12/11/24 | Price Changed | $230,000 | -1.1% | $136 / Sq Ft |
| 12/10/2024 12/10/24 | Price Changed | $232,500 | -1.1% | $138 / Sq Ft |
| 12/06/2024 12/06/24 | Price Changed | $235,000 | -2.1% | $139 / Sq Ft |
| 12/03/2024 12/03/24 | Price Changed | $240,000 | -0.8% | $142 / Sq Ft |
| 12/01/2024 12/01/24 | Price Changed | $242,000 | -1.2% | $143 / Sq Ft |
| 11/21/2024 11/21/24 | Price Changed | $245,000 | -2.0% | $145 / Sq Ft |
| 11/12/2024 11/12/24 | For Sale | $249,900 | 0.0% | $183 / Sq Ft |
| 11/07/2024 11/07/24 | For Sale | $249,900 | +35.1% | $148 / Sq Ft |
| 07/21/2023 07/21/23 | Off Market | -- | -- | -- |
| 08/12/2022 08/12/22 | Sold | -- | -- | -- |
| 08/10/2022 08/10/22 | Pending | -- | -- | -- |
| 08/07/2022 08/07/22 | For Sale | $185,000 | -- | $135 / Sq Ft |
Source: San Antonio Board of REALTORS®
Tax History Compared to Growth
Tax History
| Year | Tax Paid | Tax Assessment Tax Assessment Total Assessment is a certain percentage of the fair market value that is determined by local assessors to be the total taxable value of land and additions on the property. | Land | Improvement |
|---|---|---|---|---|
| 2023 | $5,255 | $224,060 | $73,010 | $151,050 |
| 2022 | $4,580 | $167,886 | $55,300 | $159,530 |
| 2021 | $4,125 | $152,624 | $40,180 | $138,630 |
| 2020 | $3,888 | $138,749 | $33,840 | $133,410 |
| 2019 | $3,610 | $126,135 | $28,080 | $119,330 |
| 2018 | $3,250 | $114,668 | $28,080 | $99,710 |
| 2017 | $2,959 | $104,244 | $21,460 | $96,150 |
| 2016 | $2,690 | $94,767 | $11,750 | $103,030 |
| 2015 | $1,038 | $86,152 | $11,750 | $88,830 |
| 2014 | $1,038 | $78,320 | $0 | $0 |
Source: Public Records
Agents Affiliated with this Home
-
Vince Salas
V
Seller's Agent in 2024
Vince Salas
Texas Home Realty
(210) 802-9457
1 in this area
134 Total Sales
Map
Source: San Antonio Board of REALTORS®
MLS Number: 1629319
APN: 07686-020-0110
Disclaimer: Certain information contained herein is derived from information provided by parties other than Homes.com. All information provided is deemed reliable, but is not guaranteed to be accurate and should be independently verified.
![]() IDX information is provided exclusively for personal, non-commercial use, and may not be used for any purpose other than to identify prospective properties consumers may be interested in purchasing.
IDX information is provided exclusively for personal, non-commercial use, and may not be used for any purpose other than to identify prospective properties consumers may be interested in purchasing.
Information is deemed reliable but not guaranteed.
Nearby Homes
- 210 E Huff Ave
- 403 Terrell Ave
- 710 E Southcross Blvd
- 722 E Southcross Blvd
- 230 Ravenhill Dr
- 539 E Pyron Ave
- 214 W Huff Ave
- 175 Kelly Dr
- 5415 Quintard
- 331 Bustillos Dr
- 2509 Mission Rd
- 608 E Harlan Ave
- 7234 Briar Place
- 251 Shasta Ave
- 211 Lorita Dr
- 5115 Quintard
- 314 Shrine Ave
- 101 New York Place
- 103 New York Place
- 403 W Dickson Ave