
Seller's Agent in 2022
John A. McCann
C A McCann and Sons, Inc
(609) 408-8106
2 in this area
148 Total Sales
Estimated Value: $342,000 - $395,000
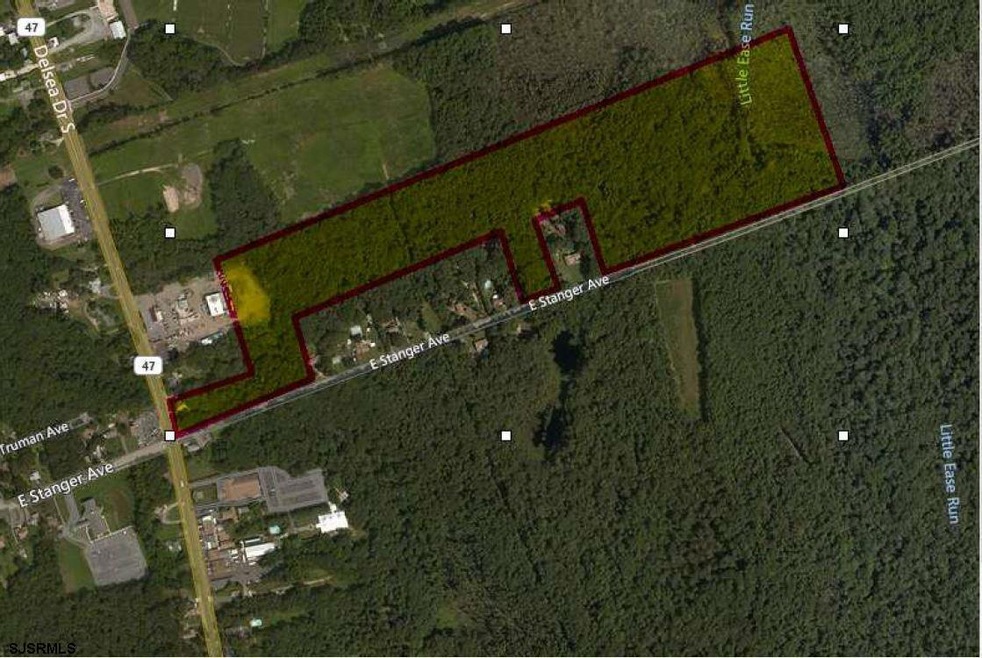
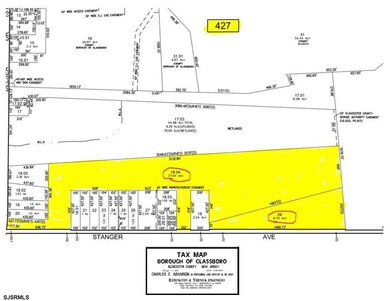
2 Large land lots of approximately 46 acres with roughly 24 acres buildable. Block 427 Lots 18.04 & 29. Can potentially be subdivided into 22 lots under R-6 zoning.
Last Buyer's Agent
AGENT NON-MEMBER
NON-MEMBER OFFICE License #00000
| Date | Buyer | Sale Price | Title Company |
|---|---|---|---|
| Foster Faulcon Alberta L | $15,000 | -- |
| Date | Event | Price | List to Sale | Price per Sq Ft |
|---|---|---|---|---|
| 11/23/2022 11/23/22 | Sold | $280,000 | -25.3% | $144 / Sq Ft |
| 07/11/2022 07/11/22 | For Sale | $375,000 | +33.9% | $193 / Sq Ft |
| 07/09/2022 07/09/22 | Off Market | $280,000 | -- | -- |
| 06/08/2022 06/08/22 | Price Changed | $375,000 | -21.1% | $193 / Sq Ft |
| 02/14/2022 02/14/22 | For Sale | $475,000 | -- | $244 / Sq Ft |
| Year | Tax Paid | Tax Assessment Tax Assessment Total Assessment is a certain percentage of the fair market value that is determined by local assessors to be the total taxable value of land and additions on the property. | Land | Improvement |
|---|---|---|---|---|
| 2025 | $8,107 | $230,300 | $59,400 | $170,900 |
| 2024 | $8,058 | $230,300 | $59,400 | $170,900 |
| 2023 | $8,058 | $230,300 | $59,400 | $170,900 |
| 2022 | $7,978 | $230,300 | $59,400 | $170,900 |
| 2021 | $8,113 | $230,300 | $59,400 | $170,900 |
| 2020 | $8,160 | $230,300 | $59,400 | $170,900 |
| 2019 | $8,173 | $230,300 | $59,400 | $170,900 |
| 2018 | $8,178 | $230,300 | $59,400 | $170,900 |
| 2017 | $8,217 | $230,300 | $59,400 | $170,900 |
| 2016 | $7,980 | $230,300 | $59,400 | $170,900 |
| 2015 | $7,807 | $230,300 | $59,400 | $170,900 |
| 2014 | $7,630 | $230,300 | $59,400 | $170,900 |
Seller's Agent in 2022
John A. McCann
C A McCann and Sons, Inc
(609) 408-8106
2 in this area
148 Total Sales
A
Buyer's Agent in 2022
AGENT NON-MEMBER
NON-MEMBER OFFICE
Source: South Jersey Shore Regional MLS
MLS Number: 559684
APN: 06-00427-0000-00018-01
Disclaimer: Certain information contained herein is derived from information provided by parties other than Homes.com. All information provided is deemed reliable, but is not guaranteed to be accurate and should be independently verified.
![]() IDX information is provided exclusively for personal, non-commercial use, and may not be used for any purpose other than to identify prospective properties consumers may be interested in purchasing.
IDX information is provided exclusively for personal, non-commercial use, and may not be used for any purpose other than to identify prospective properties consumers may be interested in purchasing.
Information is deemed reliable but not guaranteed.
© 2025 South Jersey Shore Regional Multiple Listing Service. All rights reserved.