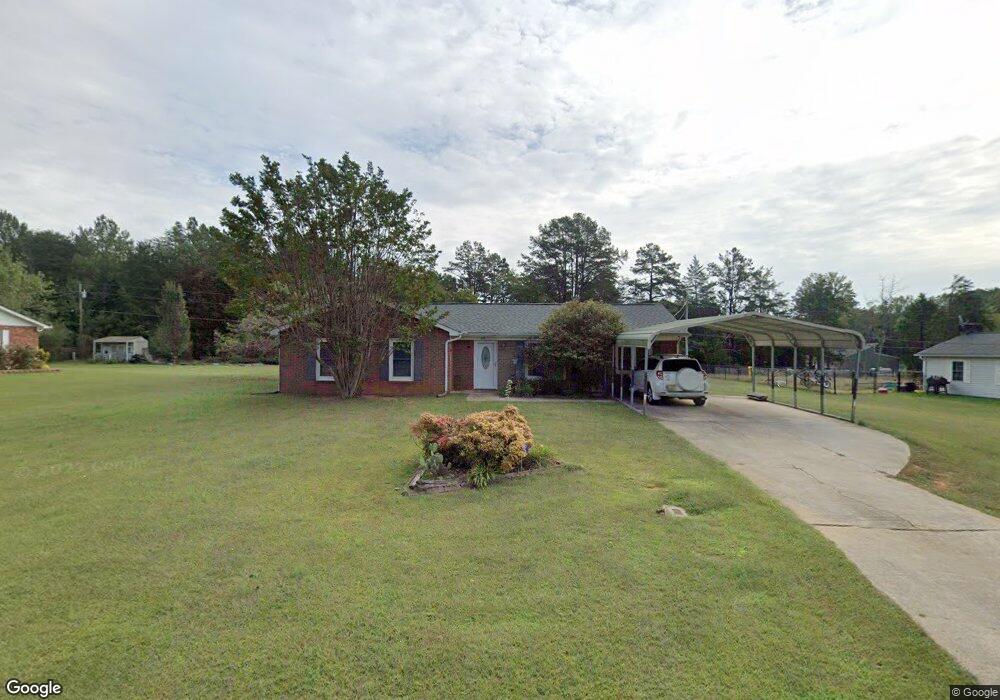
219 Mapleleaf Rd Statesville, NC 28625
Estimated Value: $226,000 - $263,000
3
Beds
2
Baths
1,458
Sq Ft
$166/Sq Ft
Est. Value
About This Home
This home is located at 219 Mapleleaf Rd, Statesville, NC 28625 and is currently estimated at $242,399, approximately $166 per square foot. 219 Mapleleaf Rd is a home located in Iredell County with nearby schools including East Iredell Elementary School, East Iredell Middle School, and North Iredell High School.
Ownership History
Date
Name
Owned For
Owner Type
Purchase Details
Closed on
Mar 13, 2003
Sold by
Knox Heather P and Knox Walter
Bought by
Joseph Devon A
Current Estimated Value
Purchase Details
Closed on
Apr 12, 2001
Sold by
Crandall Richard J and Crandall Mary Jo
Bought by
Gunnis Joseph Devon A and Gunnis Joseph Albert
Home Financials for this Owner
Home Financials are based on the most recent Mortgage that was taken out on this home.
Original Mortgage
$89,101
Outstanding Balance
$32,773
Interest Rate
6.99%
Mortgage Type
FHA
Estimated Equity
$209,626
Purchase Details
Closed on
Oct 30, 2000
Sold by
Altega Credit Corp
Bought by
Crandall Richard J and Crandall Mary Jo
Purchase Details
Closed on
Jan 27, 2000
Sold by
Beckham Charles L and Beckham Katinita L
Bought by
Altegra Credit Company
Create a Home Valuation Report for This Property
The Home Valuation Report is an in-depth analysis detailing your home's value as well as a comparison with similar homes in the area
Home Values in the Area
Average Home Value in this Area
Purchase History
| Date | Buyer | Sale Price | Title Company |
|---|---|---|---|
| Joseph Devon A | -- | -- | |
| Joseph Devon A | -- | -- | |
| Gunnis Joseph Devon A | $90,500 | -- | |
| Crandall Richard J | $42,000 | -- | |
| Altegra Credit Company | $55,000 | -- |
Source: Public Records
Mortgage History
| Date | Status | Borrower | Loan Amount |
|---|---|---|---|
| Open | Gunnis Joseph Devon A | $89,101 |
Source: Public Records
Tax History Compared to Growth
Tax History
| Year | Tax Paid | Tax Assessment Tax Assessment Total Assessment is a certain percentage of the fair market value that is determined by local assessors to be the total taxable value of land and additions on the property. | Land | Improvement |
|---|---|---|---|---|
| 2024 | $927 | $138,830 | $20,000 | $118,830 |
| 2023 | $879 | $138,830 | $20,000 | $118,830 |
| 2022 | $671 | $97,950 | $15,000 | $82,950 |
| 2021 | $671 | $97,950 | $15,000 | $82,950 |
| 2020 | $671 | $97,950 | $15,000 | $82,950 |
| 2019 | $661 | $97,950 | $15,000 | $82,950 |
| 2018 | $589 | $89,950 | $15,000 | $74,950 |
| 2017 | $589 | $89,950 | $15,000 | $74,950 |
| 2016 | $589 | $89,950 | $15,000 | $74,950 |
| 2015 | $589 | $89,950 | $15,000 | $74,950 |
| 2014 | $557 | $90,930 | $15,000 | $75,930 |
Source: Public Records
Map
Nearby Homes
- 174 Birchwood Rd Unit 24
- 199 Bell Farm Rd
- 0 Warren Rd Unit 3814365
- 215 Lone Pine Rd
- 181 Lone Pine Rd
- 000 Pops Lake Rd
- 106 Brookmeade Dr
- 251 Gleneagles Rd E
- 219 E Glen Eagles Rd
- 629 Saint Andrews Rd
- 625 Saint Andrews Rd
- 627 Saint Andrews Rd
- 522 Saint Cloud Dr
- 258 New Salem Rd
- 605 Saint Cloud Dr
- 358 New Salem Rd
- 720 Saint Cloud Dr
- 152 Sparrow Ln
- 154 Carters Farm Dr
- 135 Carters Farm Dr
- 213 Mapleleaf Rd
- 225 Mapleleaf Rd
- 203 Birchwood Rd
- 209 Mapleleaf Rd
- 216 Mapleleaf Rd
- 145 Birchwood Rd
- 153 Birchwood Rd
- 151 Birchwood Rd
- 147 Birchwood Rd
- 221 Birchwood Rd
- 199 Birchwood Rd
- 203 Mapleleaf Rd
- 206 Mapleleaf Rd
- 109 Hamby Ln
- 212 Birchwood Rd
- 208 Birchwood Rd
- 115 Hamby Ln
- 195 Birchwood Rd
- 204 Birchwood Rd
- 133 Redwood Ln