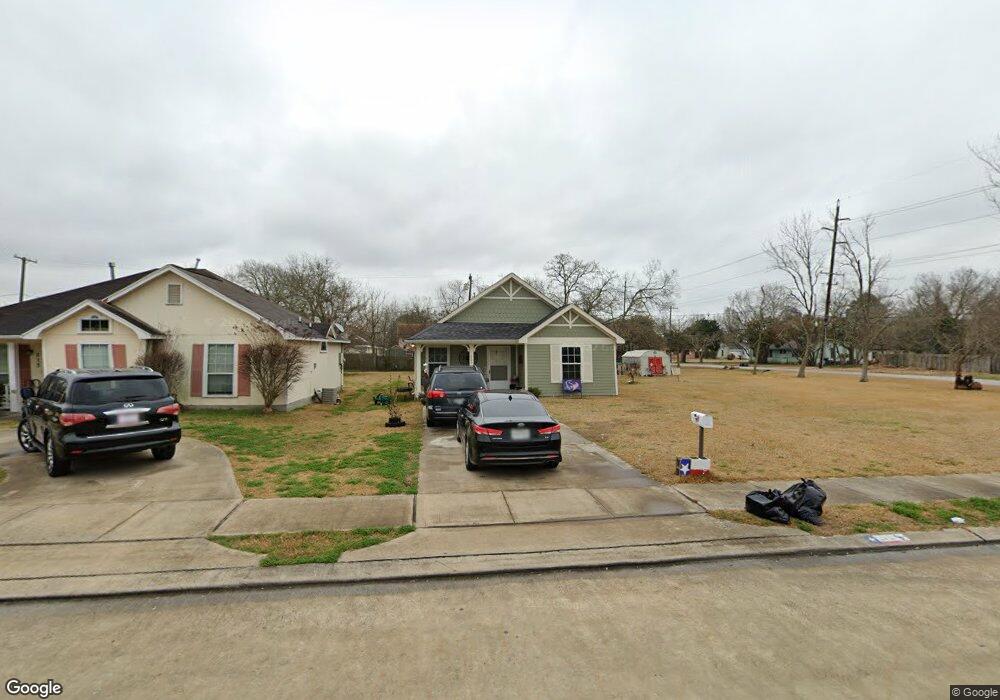
219 S 3rd St La Porte, TX 77571
Estimated Value: $213,107 - $268,000
3
Beds
2
Baths
1,485
Sq Ft
$160/Sq Ft
Est. Value
About This Home
This home is located at 219 S 3rd St, La Porte, TX 77571 and is currently estimated at $238,277, approximately $160 per square foot. 219 S 3rd St is a home located in Harris County with nearby schools including La Porte Elementary School, La Porte Junior High School, and La Porte High School.
Ownership History
Date
Name
Owned For
Owner Type
Purchase Details
Closed on
Feb 9, 1999
Sold by
Brookhollow Corp
Bought by
Wiley Scott
Current Estimated Value
Home Financials for this Owner
Home Financials are based on the most recent Mortgage that was taken out on this home.
Original Mortgage
$10,000
Outstanding Balance
$2,389
Interest Rate
6.85%
Mortgage Type
Seller Take Back
Estimated Equity
$235,888
Purchase Details
Closed on
Feb 8, 1999
Sold by
Means Gart E and Means Mary H
Bought by
Means Carl James and Means Leoylian
Home Financials for this Owner
Home Financials are based on the most recent Mortgage that was taken out on this home.
Original Mortgage
$10,000
Outstanding Balance
$2,389
Interest Rate
6.85%
Mortgage Type
Seller Take Back
Estimated Equity
$235,888
Purchase Details
Closed on
Jul 1, 1988
Sold by
Lopez George and Lopez Josefa
Bought by
Gutierrez Lucindo and Gutierrez Rosalinda
Create a Home Valuation Report for This Property
The Home Valuation Report is an in-depth analysis detailing your home's value as well as a comparison with similar homes in the area
Home Values in the Area
Average Home Value in this Area
Purchase History
| Date | Buyer | Sale Price | Title Company |
|---|---|---|---|
| Wiley Scott | -- | -- | |
| Means Carl James | $90,022 | -- | |
| Gutierrez Lucindo | -- | -- |
Source: Public Records
Mortgage History
| Date | Status | Borrower | Loan Amount |
|---|---|---|---|
| Open | Wiley Scott | $10,000 |
Source: Public Records
Tax History Compared to Growth
Tax History
| Year | Tax Paid | Tax Assessment Tax Assessment Total Assessment is a certain percentage of the fair market value that is determined by local assessors to be the total taxable value of land and additions on the property. | Land | Improvement |
|---|---|---|---|---|
| 2025 | $517 | $225,527 | $58,438 | $167,089 |
| 2024 | $517 | $216,838 | $58,438 | $158,400 |
| 2023 | $517 | $241,653 | $58,438 | $183,215 |
| 2022 | $5,335 | $219,572 | $58,438 | $161,134 |
| 2021 | $4,966 | $182,504 | $55,000 | $127,504 |
| 2020 | $4,801 | $172,399 | $34,375 | $138,024 |
| 2019 | $4,773 | $177,695 | $34,375 | $143,320 |
| 2018 | $818 | $149,388 | $20,625 | $128,763 |
| 2017 | $4,260 | $146,977 | $17,188 | $129,789 |
| 2016 | $3,873 | $131,403 | $11,719 | $119,684 |
| 2015 | -- | $44,774 | $11,719 | $33,055 |
| 2014 | -- | $44,774 | $11,719 | $33,055 |
Source: Public Records
Map
Nearby Homes
- 416 S 1st St
- 216 San Jacinto St
- 507 S 3rd St
- 0 N 1st Ave
- 424 S Broadway St
- 0 Broadway Unit 47596766
- 114 Dr Martin Luther King jr Dr
- 111 N 6th St
- 208 S 7th St
- 531 S 2nd St
- 123 S Virginia St
- 1200 BLOCK S 2nd St
- 317 San Jacinto St
- 131 S Virginia St
- 135 S Virginia St
- 301 S Virginia St
- 407 San Jacinto St
- 314 E Main St
- 406 S Iowa St
- 422 N 7th St