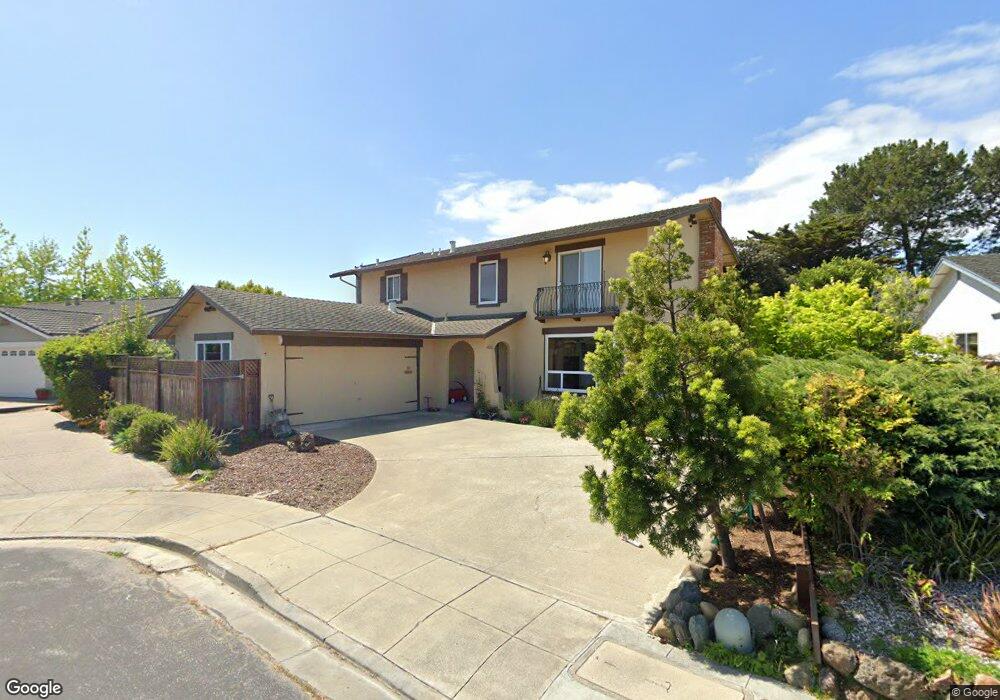
219 Stilt Ct Foster City, CA 94404
Bay Vista NeighborhoodEstimated Value: $2,005,000 - $2,304,000
4
Beds
3
Baths
2,160
Sq Ft
$1,008/Sq Ft
Est. Value
About This Home
This home is located at 219 Stilt Ct, Foster City, CA 94404 and is currently estimated at $2,177,225, approximately $1,007 per square foot. 219 Stilt Ct is a home located in San Mateo County with nearby schools including Audubon Elementary School, Bowditch Middle School, and San Mateo High School.
Ownership History
Date
Name
Owned For
Owner Type
Purchase Details
Closed on
Oct 6, 2016
Sold by
Moore Boncore Nicole and Boncore Nicole
Bought by
Moore Boncore Nicole
Current Estimated Value
Home Financials for this Owner
Home Financials are based on the most recent Mortgage that was taken out on this home.
Original Mortgage
$600,000
Outstanding Balance
$481,012
Interest Rate
3.46%
Mortgage Type
New Conventional
Estimated Equity
$1,696,213
Purchase Details
Closed on
Mar 25, 2013
Sold by
Moore Stephen D and Moore Phyllis J
Bought by
Moore Boncore Nicole
Purchase Details
Closed on
Oct 8, 2012
Sold by
Boncore Dominick
Bought by
Boncore Nicole
Purchase Details
Closed on
Jun 1, 2007
Sold by
Sala Leslie and Phillips Bradley J
Bought by
Boncore Dominick and Moore Boncore Nicole
Home Financials for this Owner
Home Financials are based on the most recent Mortgage that was taken out on this home.
Original Mortgage
$625,000
Interest Rate
8.37%
Mortgage Type
Negative Amortization
Purchase Details
Closed on
May 12, 1995
Sold by
Phillips Stuart J
Bought by
Phillips Stuart J
Create a Home Valuation Report for This Property
The Home Valuation Report is an in-depth analysis detailing your home's value as well as a comparison with similar homes in the area
Home Values in the Area
Average Home Value in this Area
Purchase History
| Date | Buyer | Sale Price | Title Company |
|---|---|---|---|
| Moore Boncore Nicole | -- | North American Title Co Inc | |
| Moore Boncore Nicole | -- | None Available | |
| Boncore Nicole | -- | None Available | |
| Boncore Dominick | $925,000 | North American Title Company | |
| Phillips Stuart J | -- | -- |
Source: Public Records
Mortgage History
| Date | Status | Borrower | Loan Amount |
|---|---|---|---|
| Open | Moore Boncore Nicole | $600,000 | |
| Closed | Boncore Dominick | $625,000 |
Source: Public Records
Tax History Compared to Growth
Tax History
| Year | Tax Paid | Tax Assessment Tax Assessment Total Assessment is a certain percentage of the fair market value that is determined by local assessors to be the total taxable value of land and additions on the property. | Land | Improvement |
|---|---|---|---|---|
| 2025 | $14,670 | $1,260,882 | $668,541 | $592,341 |
| 2023 | $14,670 | $1,211,925 | $642,583 | $569,342 |
| 2022 | $14,176 | $1,188,163 | $629,984 | $558,179 |
| 2021 | $13,992 | $1,164,867 | $617,632 | $547,235 |
| 2020 | $13,607 | $1,152,924 | $611,300 | $541,624 |
| 2019 | $12,893 | $1,130,319 | $599,314 | $531,005 |
| 2018 | $12,370 | $1,108,158 | $587,564 | $520,594 |
| 2017 | $12,231 | $1,086,431 | $576,044 | $510,387 |
| 2016 | $12,263 | $1,065,130 | $564,750 | $500,380 |
| 2015 | $11,979 | $1,049,133 | $556,268 | $492,865 |
| 2014 | $11,676 | $1,028,585 | $545,373 | $483,212 |
Source: Public Records
Map
Nearby Homes
- 275 Puffin Ct
- 748 Gull Ave
- 224 Loon Ct
- 650 Pilgrim Dr
- 1074 Eagle Ln
- 1351 Marlin Ave
- 1336 Marlin Ave
- 591 Pilgrim Dr
- 3206 Admiralty Ln
- 1102 Admiralty Ln
- 241 Bonita Ln
- 708 Thayer Ln Unit 404
- 769 Eppleton Ln Unit 302
- 1028 Foster Square Ln Unit 305
- 708 Eppleton Ln Unit 204
- 718 Eppleton Ln Unit 303
- 926 Lido Ln
- 1018 Lido Ln
- 370 Bramble Ct
- 825 Cortez Ln