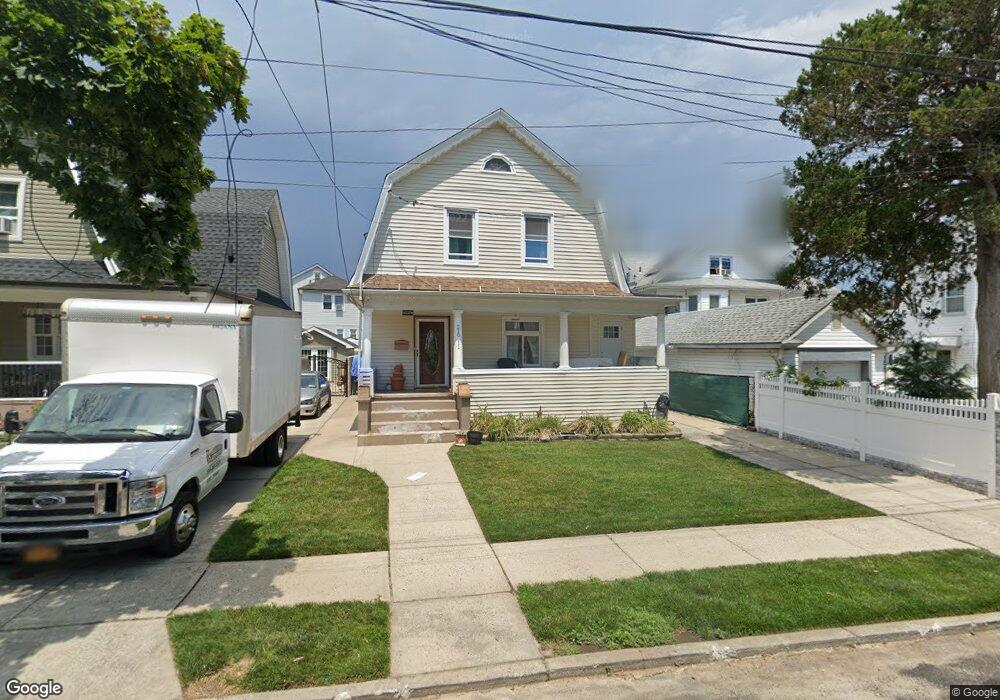
21911 101st Ave Queens Village, NY 11429
Queens Village NeighborhoodEstimated Value: $677,473 - $873,000
--
Bed
--
Bath
1,536
Sq Ft
$515/Sq Ft
Est. Value
About This Home
This home is located at 21911 101st Ave, Queens Village, NY 11429 and is currently estimated at $790,368, approximately $514 per square foot. 21911 101st Ave is a home located in Queens County with nearby schools including P.S. 34 John Harvard, Jean Nuzzi Intermediate School, and Ss Joachim & Anne School.
Ownership History
Date
Name
Owned For
Owner Type
Purchase Details
Closed on
Apr 20, 2007
Sold by
Richmond Ronald D
Bought by
Benjamin Robin
Current Estimated Value
Purchase Details
Closed on
Jun 17, 1999
Sold by
Richmond Sonia
Bought by
Richmond Ronald D
Home Financials for this Owner
Home Financials are based on the most recent Mortgage that was taken out on this home.
Original Mortgage
$197,899
Interest Rate
7.6%
Purchase Details
Closed on
Jul 31, 1995
Sold by
Bennett Marjorie J and Maxwell Mildred E
Bought by
Richmond Sonia
Home Financials for this Owner
Home Financials are based on the most recent Mortgage that was taken out on this home.
Original Mortgage
$154,900
Interest Rate
7.89%
Mortgage Type
FHA
Create a Home Valuation Report for This Property
The Home Valuation Report is an in-depth analysis detailing your home's value as well as a comparison with similar homes in the area
Home Values in the Area
Average Home Value in this Area
Purchase History
| Date | Buyer | Sale Price | Title Company |
|---|---|---|---|
| Benjamin Robin | -- | -- | |
| Benjamin Robin | -- | -- | |
| Richmond Ronald D | $198,000 | -- | |
| Richmond Ronald D | $198,000 | -- | |
| Richmond Sonia | $155,000 | Inter Country Title Guaranty | |
| Richmond Sonia | $155,000 | Inter Country Title Guaranty |
Source: Public Records
Mortgage History
| Date | Status | Borrower | Loan Amount |
|---|---|---|---|
| Previous Owner | Richmond Ronald D | $197,899 | |
| Previous Owner | Richmond Sonia | $154,900 | |
| Closed | Richmond Sonia | $6 | |
| Closed | Benjamin Robin | $0 |
Source: Public Records
Tax History Compared to Growth
Tax History
| Year | Tax Paid | Tax Assessment Tax Assessment Total Assessment is a certain percentage of the fair market value that is determined by local assessors to be the total taxable value of land and additions on the property. | Land | Improvement |
|---|---|---|---|---|
| 2025 | $5,526 | $29,129 | $9,294 | $19,835 |
| 2024 | $5,526 | $27,515 | $10,523 | $16,992 |
| 2023 | $5,267 | $26,225 | $8,544 | $17,681 |
| 2022 | $4,978 | $41,400 | $13,860 | $27,540 |
| 2021 | $5,248 | $37,500 | $13,860 | $23,640 |
| 2020 | $5,138 | $35,880 | $13,860 | $22,020 |
| 2019 | $4,797 | $36,360 | $13,860 | $22,500 |
| 2018 | $4,455 | $21,854 | $8,704 | $13,150 |
| 2017 | $4,236 | $20,780 | $10,909 | $9,871 |
| 2016 | $4,154 | $20,780 | $10,909 | $9,871 |
| 2015 | $2,364 | $20,228 | $12,034 | $8,194 |
| 2014 | $2,364 | $19,108 | $12,991 | $6,117 |
Source: Public Records
Map
Nearby Homes
- 219-06 101st Ave
- 218-27 99th Ave
- 218-25 101st Ave
- 22211 100th Rd
- 102-20 218th Place
- 99-10 218th St
- 97-16 222nd St
- 104-12 219th St
- 218-34 104th Ave
- 218-17 104th Ave
- 105-03 221st St Unit 3
- 217-27 99th Ave
- 94-86 218th St
- 10465 Springfield Blvd
- 21919 107th Ave
- 21727 Hempstead Ave
- 219-19 107th Ave
- 22126 106th Ave
- 107-01 Monterey St
- 107-05 Monterey St
- 21907 101st Ave
- 219-19 220 St
- 21903 101st Ave
- 10020 220th St
- 100-20 220th St
- 219-40 100th Dr
- 21940 100th Ave
- 21936 100th Ave
- 21936 100th Ave
- 10016 220th St
- 21940 100th Ave
- 10102 220th St
- 21950 100th Dr
- 21910 101st Ave
- 21906 101st Ave
- 21902 101st Ave
- 101-06 220th St
- 10106 220th St
- 10001 Springfield Blvd
- 10110 220th St