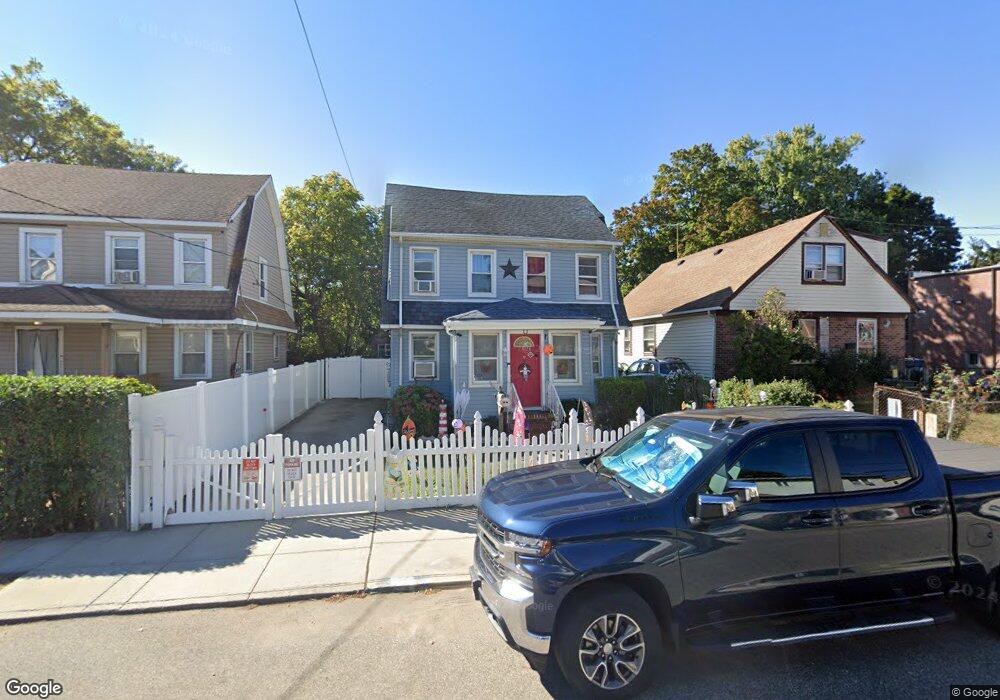
21926 102nd Ave Queens Village, NY 11429
Queens Village NeighborhoodEstimated Value: $693,108 - $774,000
--
Bed
--
Bath
1,312
Sq Ft
$558/Sq Ft
Est. Value
About This Home
This home is located at 21926 102nd Ave, Queens Village, NY 11429 and is currently estimated at $732,027, approximately $557 per square foot. 21926 102nd Ave is a home located in Queens County with nearby schools including P.S. 34 John Harvard, Jean Nuzzi Intermediate School, and Ss Joachim & Anne School.
Ownership History
Date
Name
Owned For
Owner Type
Purchase Details
Closed on
Sep 19, 2006
Sold by
Creese Leroy W and Peterkin Creese Lana
Bought by
Galvez Jerome and Salcedo Mary Rose
Current Estimated Value
Home Financials for this Owner
Home Financials are based on the most recent Mortgage that was taken out on this home.
Original Mortgage
$438,045
Outstanding Balance
$261,195
Interest Rate
6.54%
Mortgage Type
Purchase Money Mortgage
Estimated Equity
$470,832
Purchase Details
Closed on
Mar 30, 1999
Sold by
Goldcoast Management Inc
Bought by
Creese Lana Peterkin and Creese Leroy W
Home Financials for this Owner
Home Financials are based on the most recent Mortgage that was taken out on this home.
Original Mortgage
$167,550
Interest Rate
6.88%
Purchase Details
Closed on
Oct 14, 1998
Sold by
Moody Seroge N
Bought by
Gold Coast Management Inc
Home Financials for this Owner
Home Financials are based on the most recent Mortgage that was taken out on this home.
Original Mortgage
$90,000
Interest Rate
18%
Mortgage Type
Stand Alone First
Create a Home Valuation Report for This Property
The Home Valuation Report is an in-depth analysis detailing your home's value as well as a comparison with similar homes in the area
Home Values in the Area
Average Home Value in this Area
Purchase History
| Date | Buyer | Sale Price | Title Company |
|---|---|---|---|
| Galvez Jerome | $461,100 | -- | |
| Creese Lana Peterkin | $169,000 | -- | |
| Gold Coast Management Inc | $100,000 | -- |
Source: Public Records
Mortgage History
| Date | Status | Borrower | Loan Amount |
|---|---|---|---|
| Open | Galvez Jerome | $438,045 | |
| Previous Owner | Creese Lana Peterkin | $167,550 | |
| Previous Owner | Gold Coast Management Inc | $90,000 |
Source: Public Records
Tax History Compared to Growth
Tax History
| Year | Tax Paid | Tax Assessment Tax Assessment Total Assessment is a certain percentage of the fair market value that is determined by local assessors to be the total taxable value of land and additions on the property. | Land | Improvement |
|---|---|---|---|---|
| 2025 | $6,187 | $34,134 | $10,658 | $23,476 |
| 2024 | $6,199 | $32,203 | $12,050 | $20,153 |
| 2023 | $5,821 | $30,382 | $10,827 | $19,555 |
| 2022 | $5,435 | $39,360 | $13,920 | $25,440 |
| 2021 | $5,736 | $36,240 | $13,920 | $22,320 |
| 2020 | $5,725 | $34,740 | $13,920 | $20,820 |
| 2019 | $5,321 | $35,040 | $13,920 | $21,120 |
| 2018 | $4,863 | $25,318 | $11,914 | $13,404 |
| 2017 | $4,569 | $23,886 | $12,099 | $11,787 |
| 2016 | $4,465 | $23,886 | $12,099 | $11,787 |
| 2015 | $2,498 | $23,704 | $14,561 | $9,143 |
| 2014 | $2,498 | $22,364 | $14,607 | $7,757 |
Source: Public Records
Map
Nearby Homes
- 219-06 101st Ave
- 218-25 101st Ave
- 218-27 99th Ave
- 102-20 218th Place
- 99-10 218th St
- 104-12 219th St
- 218-34 104th Ave
- 218-17 104th Ave
- 22211 100th Rd
- 105-03 221st St Unit 3
- 217-27 99th Ave
- 97-16 222nd St
- 10465 Springfield Blvd
- 94-86 218th St
- 21919 107th Ave
- 219-19 107th Ave
- 21727 Hempstead Ave
- 22126 106th Ave
- 107-01 Monterey St
- 107-05 Monterey St
- 21922 102nd Ave
- 21930 102nd Ave
- 21934 102nd Ave
- 21934 102nd Ave
- 21889 Hempstead Ave
- 21887 Hempstead Ave
- 21885 Hempstead Ave
- 21901 Hempstead Ave
- 218-91 Hempstead Ave Unit 2
- 21893 Hempstead Ave
- 21891 Hempstead Ave
- 21938 102nd Ave
- 21883 Hempstead Ave
- 21903 Hempstead Ave
- 219-01 Hempstead Ave
- 218-85 Hempstead Ave Unit 2
- 21881 Hempstead Ave
- 21929 102nd Ave
- 218-83 Hempstead Ave Unit 2
- 218-83 Hempstead Ave