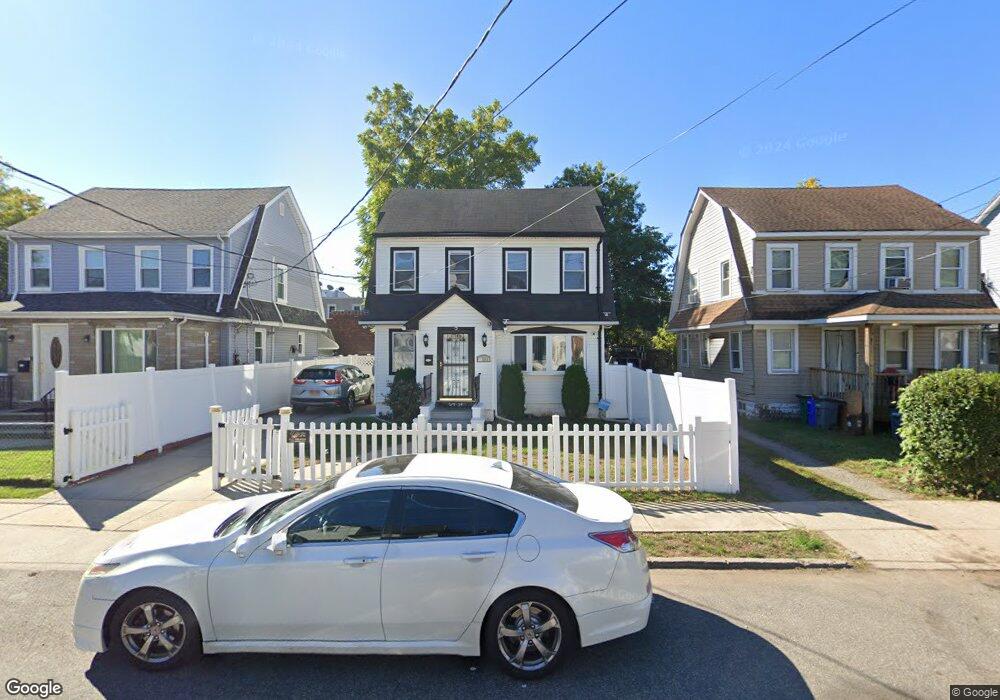
21934 102nd Ave Queens Village, NY 11429
Queens Village NeighborhoodEstimated Value: $665,000 - $695,127
3
Beds
1
Bath
1,200
Sq Ft
$567/Sq Ft
Est. Value
About This Home
This home is located at 21934 102nd Ave, Queens Village, NY 11429 and is currently estimated at $680,032, approximately $566 per square foot. 21934 102nd Ave is a home located in Queens County with nearby schools including P.S. 34 John Harvard, Jean Nuzzi Intermediate School, and Ss Joachim & Anne School.
Ownership History
Date
Name
Owned For
Owner Type
Purchase Details
Closed on
Jun 7, 2016
Sold by
Rani & Moe Inc
Bought by
Garcia Niurka M and Garcia Peter A
Current Estimated Value
Home Financials for this Owner
Home Financials are based on the most recent Mortgage that was taken out on this home.
Original Mortgage
$427,500
Outstanding Balance
$341,017
Interest Rate
3.64%
Mortgage Type
New Conventional
Estimated Equity
$339,015
Purchase Details
Closed on
Jan 13, 2016
Sold by
Lsf9 Master Participation Trust and U S Bank Trust N A As Trustee
Bought by
Rani & Moe Inc
Purchase Details
Closed on
Mar 6, 2015
Sold by
Uzamere Eugene Esq
Bought by
U S Bank Trust N A As Trustee For Ls
Purchase Details
Closed on
Sep 8, 2006
Sold by
Davidson Juanita and Davidson Jack Charmaine
Bought by
Raulins Denise and Raulins Roy L
Home Financials for this Owner
Home Financials are based on the most recent Mortgage that was taken out on this home.
Original Mortgage
$422,750
Interest Rate
6.59%
Mortgage Type
Purchase Money Mortgage
Create a Home Valuation Report for This Property
The Home Valuation Report is an in-depth analysis detailing your home's value as well as a comparison with similar homes in the area
Home Values in the Area
Average Home Value in this Area
Purchase History
| Date | Buyer | Sale Price | Title Company |
|---|---|---|---|
| Garcia Niurka M | $450,000 | -- | |
| Rani & Moe Inc | $320,888 | -- | |
| U S Bank Trust N A As Trustee For Ls | $500 | -- | |
| Raulins Denise | $445,000 | -- |
Source: Public Records
Mortgage History
| Date | Status | Borrower | Loan Amount |
|---|---|---|---|
| Open | Garcia Niurka M | $427,500 | |
| Previous Owner | Raulins Denise | $422,750 |
Source: Public Records
Tax History Compared to Growth
Tax History
| Year | Tax Paid | Tax Assessment Tax Assessment Total Assessment is a certain percentage of the fair market value that is determined by local assessors to be the total taxable value of land and additions on the property. | Land | Improvement |
|---|---|---|---|---|
| 2025 | $5,771 | $30,457 | $9,399 | $21,058 |
| 2024 | $5,771 | $28,733 | $9,873 | $18,860 |
| 2023 | $5,445 | $27,108 | $9,824 | $17,284 |
| 2022 | $4,381 | $35,820 | $12,720 | $23,100 |
| 2021 | $4,658 | $33,720 | $12,720 | $21,000 |
| 2020 | $4,648 | $33,060 | $12,720 | $20,340 |
| 2019 | $4,284 | $31,380 | $12,720 | $18,660 |
| 2018 | $4,605 | $22,590 | $10,125 | $12,465 |
| 2017 | $4,344 | $21,312 | $10,176 | $11,136 |
| 2016 | $4,136 | $21,312 | $10,176 | $11,136 |
| 2015 | $2,205 | $21,151 | $12,877 | $8,274 |
| 2014 | $2,205 | $19,954 | $12,538 | $7,416 |
Source: Public Records
Map
Nearby Homes
- 219-06 101st Ave
- 102-20 218th Place
- 218-25 101st Ave
- 218-27 99th Ave
- 104-12 219th St
- 22211 100th Rd
- 99-10 218th St
- 218-34 104th Ave
- 218-17 104th Ave
- 105-03 221st St Unit 3
- 97-16 222nd St
- 10465 Springfield Blvd
- 217-27 99th Ave
- 21919 107th Ave
- 219-19 107th Ave
- 22126 106th Ave
- 107-01 Monterey St
- 107-05 Monterey St
- 94-86 218th St
- 21727 Hempstead Ave
- 21934 102nd Ave
- 21930 102nd Ave
- 21938 102nd Ave
- 21926 102nd Ave
- 219-37 220 St
- 21922 102nd Ave
- 21903 Hempstead Ave
- 21901 Hempstead Ave
- 21907 Hempstead Ave
- 21905 Hempstead Ave
- 219-01 Hempstead Ave
- 21909 Hempstead Ave
- 21893 Hempstead Ave
- 21929 102nd Ave
- 21891 Hempstead Ave
- 22004 102nd Ave
- 21889 Hempstead Ave
- 21929 102nd Ave
- 218-91 Hempstead Ave Unit 2
- 219-05 Hempstead Ave Unit COMMERCIAL