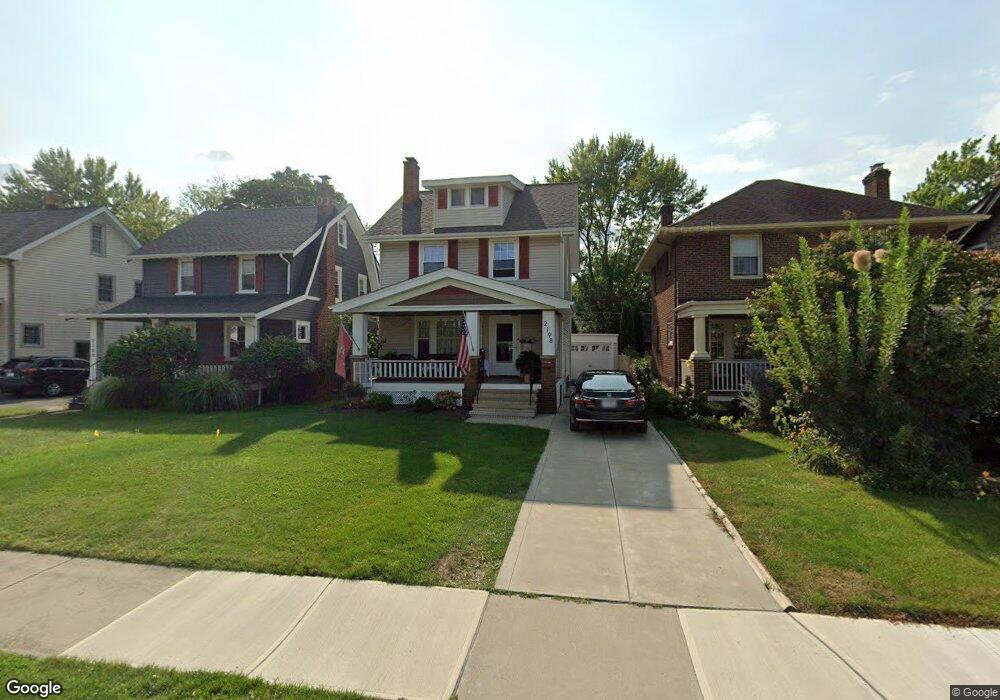
2198 Glenbury Ave Lakewood, OH 44107
Estimated Value: $278,828 - $326,000
3
Beds
1
Bath
1,144
Sq Ft
$258/Sq Ft
Est. Value
About This Home
This home is located at 2198 Glenbury Ave, Lakewood, OH 44107 and is currently estimated at $295,707, approximately $258 per square foot. 2198 Glenbury Ave is a home located in Cuyahoga County with nearby schools including Hayes Elementary School, Harding Middle School, and Lakewood High School.
Ownership History
Date
Name
Owned For
Owner Type
Purchase Details
Closed on
Jul 16, 2021
Bought by
Tennant Craig E and Tennant Tracy
Current Estimated Value
Purchase Details
Closed on
Aug 29, 1995
Sold by
Dieter Dean C
Bought by
Tennont Craig E and Tennont Tracy
Home Financials for this Owner
Home Financials are based on the most recent Mortgage that was taken out on this home.
Original Mortgage
$79,900
Interest Rate
7.43%
Mortgage Type
New Conventional
Purchase Details
Closed on
Mar 31, 1989
Sold by
Smith Timothy G and Smith Regina T
Bought by
Dieter Dean C
Purchase Details
Closed on
Apr 28, 1986
Sold by
Smith Timothy G and Smith Regina T
Bought by
Smith Timothy G and Smith Regina T
Purchase Details
Closed on
Aug 29, 1984
Sold by
Dunn John T
Bought by
Smith Timothy G and Smith Regina T
Purchase Details
Closed on
Feb 16, 1979
Sold by
Shaffer John M and Shaffer Gladys D
Bought by
Dunn John T
Purchase Details
Closed on
Jan 1, 1975
Bought by
Shaffer John M and Shaffer Gladys D
Create a Home Valuation Report for This Property
The Home Valuation Report is an in-depth analysis detailing your home's value as well as a comparison with similar homes in the area
Home Values in the Area
Average Home Value in this Area
Purchase History
| Date | Buyer | Sale Price | Title Company |
|---|---|---|---|
| Tennant Craig E | -- | -- | |
| Tennont Craig E | $94,000 | -- | |
| Dieter Dean C | $76,000 | -- | |
| Smith Timothy G | -- | -- | |
| Smith Timothy G | $56,000 | -- | |
| Dunn John T | $51,500 | -- | |
| Shaffer John M | -- | -- |
Source: Public Records
Mortgage History
| Date | Status | Borrower | Loan Amount |
|---|---|---|---|
| Previous Owner | Tennont Craig E | $79,900 |
Source: Public Records
Tax History Compared to Growth
Tax History
| Year | Tax Paid | Tax Assessment Tax Assessment Total Assessment is a certain percentage of the fair market value that is determined by local assessors to be the total taxable value of land and additions on the property. | Land | Improvement |
|---|---|---|---|---|
| 2024 | $5,371 | $83,615 | $16,520 | $67,095 |
| 2023 | $4,611 | $61,430 | $13,370 | $48,060 |
| 2022 | $4,640 | $61,430 | $13,370 | $48,060 |
| 2021 | $4,593 | $61,430 | $13,370 | $48,060 |
| 2020 | $4,071 | $47,600 | $10,360 | $37,240 |
| 2019 | $3,991 | $136,000 | $29,600 | $106,400 |
| 2018 | $3,847 | $47,600 | $10,360 | $37,240 |
| 2017 | $3,735 | $40,530 | $7,910 | $32,620 |
| 2016 | $3,709 | $40,530 | $7,910 | $32,620 |
| 2015 | $3,710 | $40,530 | $7,910 | $32,620 |
| 2014 | $3,710 | $38,960 | $7,600 | $31,360 |
Source: Public Records
Map
Nearby Homes
- 2192 Glenbury Ave
- 2223 Eldred Ave
- 2239 Woodward Ave
- 2209 Woodward Ave
- 2287 Ogontz Ave
- 2234 Olive Ave
- 2111 Overbrook Ave
- 3158 W 159th St
- 1615 Wagar Ave
- 17322 Archdale Ave
- 15615 Fernway Ave
- 2165 Arthur Ave
- 1563 Wagar Ave
- 1617 Westwood Ave
- 15555 Hilliard Rd Unit 401A
- 3292 W 162nd St
- 1547 Orchard Grove Ave
- 14926 Esther Ave
- 14924 Arden Ave
- 14924 Delaware Ave
- 2200 Glenbury Ave
- 2202 Glenbury Ave
- 2188 Glenbury Ave
- 2184 Glenbury Ave
- 2208 Glenbury Ave
- 2185 Mckinley Ave
- 2189 Mckinley Ave
- 2181 Mckinley Ave
- 2182 Glenbury Ave
- 2193 Mckinley Ave
- 2197 Glenbury Ave
- 2191 Glenbury Ave
- 2201 Glenbury Ave
- 2187 Glenbury Ave
- 2205 Glenbury Ave
- 2197 Mckinley Ave
- 2173 Mckinley Ave
- 2178 Glenbury Ave
- 2176 Glenbury Ave
- 2183 Glenbury Ave