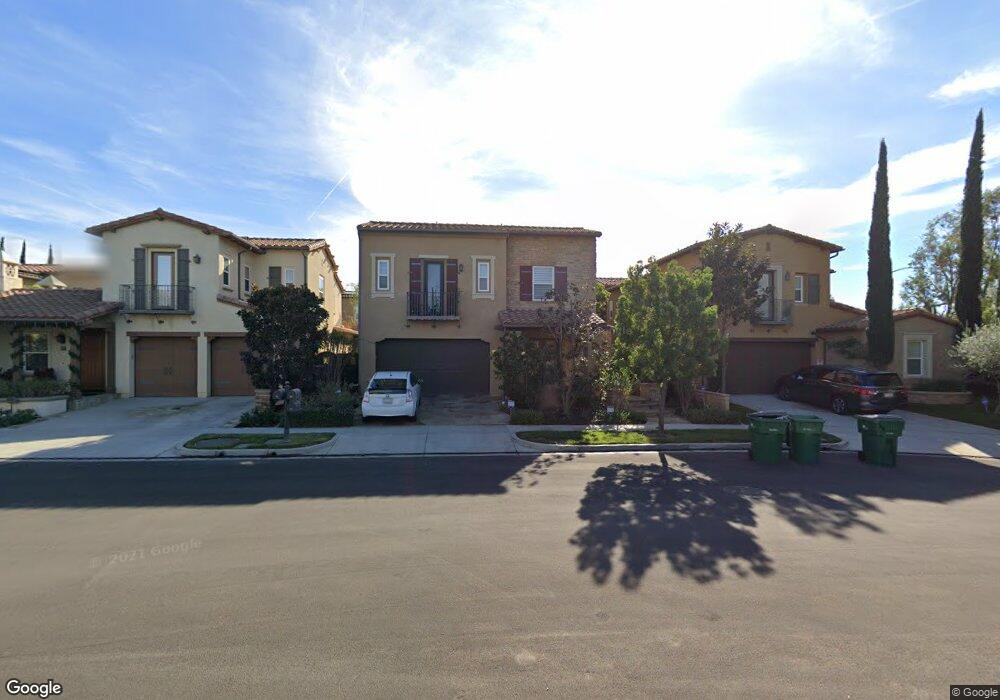
22 Lookout Irvine, CA 92620
Woodbury and Stonegate NeighborhoodEstimated Value: $2,830,000 - $2,896,000
5
Beds
4
Baths
3,630
Sq Ft
$789/Sq Ft
Est. Value
About This Home
This home is located at 22 Lookout, Irvine, CA 92620 and is currently estimated at $2,865,746, approximately $789 per square foot. 22 Lookout is a home located in Orange County with nearby schools including Jeffrey Trail Middle, Portola High School, and New Horizon Elementary School.
Ownership History
Date
Name
Owned For
Owner Type
Purchase Details
Closed on
Dec 5, 2014
Sold by
Fong Johnny Jade Shan and Fong Sunny Yu Ching
Bought by
The Fong Family Living Trust
Current Estimated Value
Purchase Details
Closed on
May 1, 2014
Sold by
Chen Hsiu Lien Li
Bought by
Fong Johnny Jade Shan and Fong Sunny Yu Ching
Purchase Details
Closed on
Dec 10, 2010
Sold by
Chen Hsiu Lien Li
Bought by
Chen Hsiu Lien Li and The 2010 Hsiu Lien Li Chen Revocable Tru
Purchase Details
Closed on
Dec 12, 2006
Sold by
Chen Chin Rong
Bought by
Chen Hsieu Lien Li
Create a Home Valuation Report for This Property
The Home Valuation Report is an in-depth analysis detailing your home's value as well as a comparison with similar homes in the area
Home Values in the Area
Average Home Value in this Area
Purchase History
| Date | Buyer | Sale Price | Title Company |
|---|---|---|---|
| The Fong Family Living Trust | -- | None Available | |
| Fong Johnny Jade Shan | -- | None Available | |
| Chen Hsiu Lien Li | -- | None Available | |
| Chen Hsieu Lien Li | -- | First American Title Co | |
| Chen Hsiu Lien Li | $1,277,000 | First American Title Co |
Source: Public Records
Tax History Compared to Growth
Tax History
| Year | Tax Paid | Tax Assessment Tax Assessment Total Assessment is a certain percentage of the fair market value that is determined by local assessors to be the total taxable value of land and additions on the property. | Land | Improvement |
|---|---|---|---|---|
| 2025 | $20,989 | $1,710,905 | $736,351 | $974,554 |
| 2024 | $20,989 | $1,677,358 | $721,912 | $955,446 |
| 2023 | $21,200 | $1,644,469 | $707,757 | $936,712 |
| 2022 | $20,766 | $1,612,225 | $693,879 | $918,346 |
| 2021 | $20,399 | $1,580,613 | $680,273 | $900,340 |
| 2020 | $20,195 | $1,564,406 | $673,297 | $891,109 |
| 2019 | $20,604 | $1,533,732 | $660,095 | $873,637 |
| 2018 | $20,263 | $1,503,659 | $647,152 | $856,507 |
| 2017 | $19,932 | $1,474,176 | $634,463 | $839,713 |
| 2016 | $19,839 | $1,445,271 | $622,022 | $823,249 |
| 2015 | $19,578 | $1,423,562 | $612,678 | $810,884 |
| 2014 | $19,055 | $1,373,954 | $600,677 | $773,277 |
Source: Public Records
Map
Nearby Homes