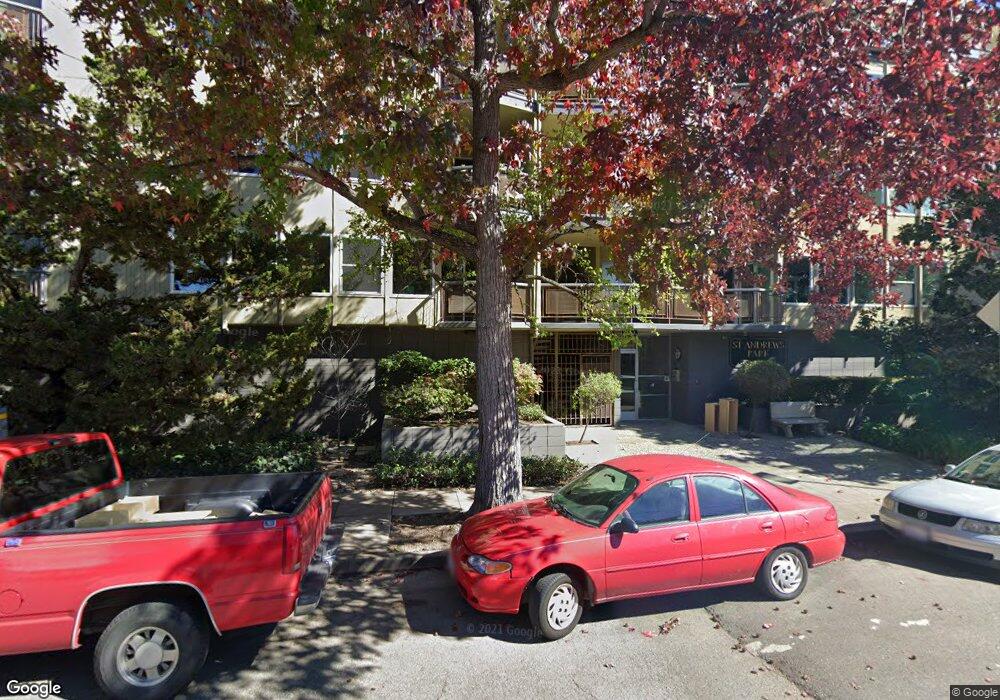
22 Moss Ave Unit 201 Oakland, CA 94610
Grand Lake NeighborhoodEstimated Value: $468,000 - $802,000
2
Beds
2
Baths
1,180
Sq Ft
$491/Sq Ft
Est. Value
About This Home
This home is located at 22 Moss Ave Unit 201, Oakland, CA 94610 and is currently estimated at $579,271, approximately $490 per square foot. 22 Moss Ave Unit 201 is a home located in Alameda County with nearby schools including Piedmont Avenue Elementary School, Westlake Middle School, and Oakland Technical High School.
Ownership History
Date
Name
Owned For
Owner Type
Purchase Details
Closed on
Jun 19, 2024
Sold by
Opara Ann
Bought by
Ann M Opara Revocable Trust and Opara
Current Estimated Value
Purchase Details
Closed on
Oct 23, 2013
Sold by
Opara Ann and Castillo Manuel
Bought by
Opara Ann
Home Financials for this Owner
Home Financials are based on the most recent Mortgage that was taken out on this home.
Original Mortgage
$135,350
Interest Rate
4.4%
Mortgage Type
New Conventional
Purchase Details
Closed on
Oct 6, 1999
Sold by
Welch Edna S
Bought by
Opara Ann
Home Financials for this Owner
Home Financials are based on the most recent Mortgage that was taken out on this home.
Original Mortgage
$132,000
Interest Rate
7.77%
Mortgage Type
Purchase Money Mortgage
Create a Home Valuation Report for This Property
The Home Valuation Report is an in-depth analysis detailing your home's value as well as a comparison with similar homes in the area
Home Values in the Area
Average Home Value in this Area
Purchase History
| Date | Buyer | Sale Price | Title Company |
|---|---|---|---|
| Ann M Opara Revocable Trust | -- | None Listed On Document | |
| Opara Ann | -- | First American Title Ins Co | |
| Opara Ann | $165,000 | Old Republic Title Co |
Source: Public Records
Mortgage History
| Date | Status | Borrower | Loan Amount |
|---|---|---|---|
| Previous Owner | Opara Ann | $135,350 | |
| Previous Owner | Opara Ann | $132,000 | |
| Closed | Opara Ann | $16,500 |
Source: Public Records
Tax History Compared to Growth
Tax History
| Year | Tax Paid | Tax Assessment Tax Assessment Total Assessment is a certain percentage of the fair market value that is determined by local assessors to be the total taxable value of land and additions on the property. | Land | Improvement |
|---|---|---|---|---|
| 2025 | $4,850 | $246,586 | $76,076 | $177,510 |
| 2024 | $4,850 | $241,614 | $74,584 | $174,030 |
| 2023 | $5,002 | $243,740 | $73,122 | $170,618 |
| 2022 | $4,818 | $231,962 | $71,688 | $167,274 |
| 2021 | $4,496 | $227,277 | $70,283 | $163,994 |
| 2020 | $4,444 | $231,877 | $69,563 | $162,314 |
| 2019 | $4,206 | $227,331 | $68,199 | $159,132 |
| 2018 | $4,119 | $222,874 | $66,862 | $156,012 |
| 2017 | $3,934 | $218,505 | $65,551 | $152,954 |
| 2016 | $3,736 | $214,221 | $64,266 | $149,955 |
| 2015 | $3,712 | $211,004 | $63,301 | $147,703 |
| 2014 | $3,676 | $206,871 | $62,061 | $144,810 |
Source: Public Records
Map
Nearby Homes
- 22 Moss Ave Unit 107
- 500 Vernon St Unit 110
- 500 Vernon St Unit 102
- 567 Oakland Ave Unit 104
- 567 Oakland Ave Unit 101
- 567 Oakland Ave Unit 305
- 695 Mariposa Ave Unit 204
- 671 Vernon St
- 127 Bayo Vista Ave Unit 108
- 555 Jean St Unit 422
- 3751 Harrison St Unit 301
- 435 Vernon St
- 433 Vernon St
- 425 Orange St Unit 112
- 590 El Dorado Ave Unit 208
- 495 Jean St
- 401 Monte Vista Ave Unit U103
- 150 Pearl St Unit 122
- 150 Pearl St Unit 106
- 150 Pearl St Unit 212
- 22 Moss Ave Unit 211
- 22 Moss Ave Unit 112
- 22 Moss Ave Unit 210
- 22 Moss Ave Unit 106
- 22 Moss Ave Unit 111
- 22 Moss Ave Unit 209
- 22 Moss Ave Unit 101
- 22 Moss Ave Unit 304
- 22 Moss Ave Unit 204
- 22 Moss Ave Unit 311
- 22 Moss Ave Unit 206
- 22 Moss Ave Unit 109
- 22 Moss Ave Unit 302
- 22 Moss Ave Unit 103
- 22 Moss Ave Unit 308
- 22 Moss Ave Unit 108
- 22 Moss Ave Unit 105
- 22 Moss Ave Unit 208
- 22 Moss Ave Unit 203
- 22 Moss Ave Unit 312