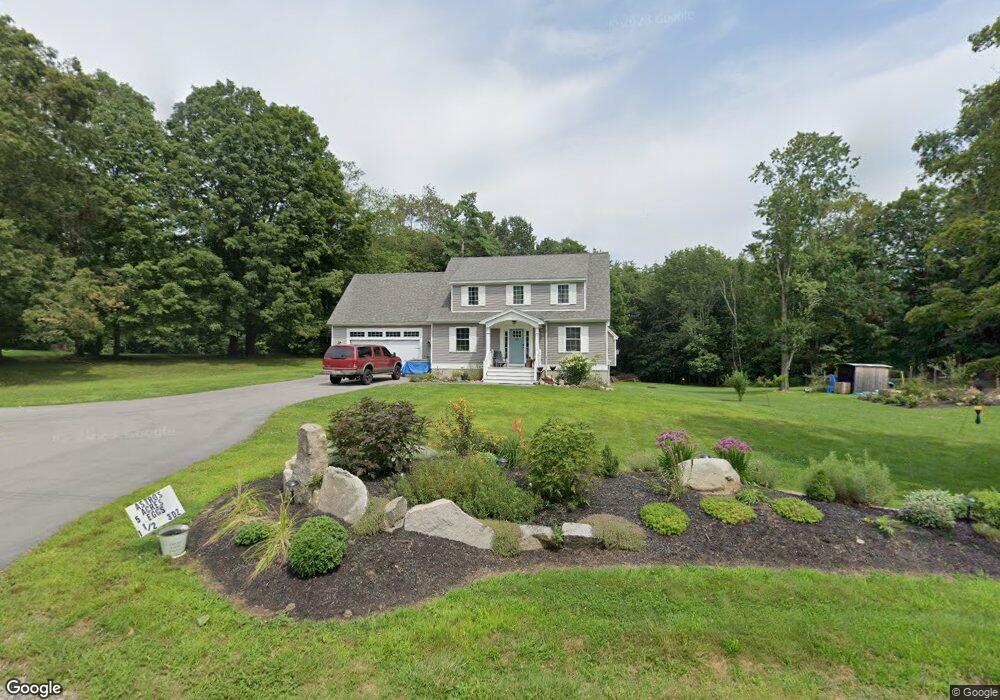
22 Old South Rd South Berwick, ME 03908
Estimated Value: $617,000 - $713,292
2
Beds
2
Baths
1,872
Sq Ft
$358/Sq Ft
Est. Value
About This Home
This home is located at 22 Old South Rd, South Berwick, ME 03908 and is currently estimated at $670,323, approximately $358 per square foot. 22 Old South Rd is a home located in York County with nearby schools including Marshwood High School, Berwick Academy, and Seacoast Christian School.
Ownership History
Date
Name
Owned For
Owner Type
Purchase Details
Closed on
Mar 25, 2019
Sold by
Harris Thomas M and Harris Miranda L
Bought by
Schmerber John J and Schmerber Rebecca J
Current Estimated Value
Purchase Details
Closed on
Jan 20, 2017
Sold by
Corliss John L
Bought by
Harris Thomas M and Harris Miranda L
Home Financials for this Owner
Home Financials are based on the most recent Mortgage that was taken out on this home.
Original Mortgage
$364,521
Interest Rate
4.13%
Mortgage Type
New Conventional
Purchase Details
Closed on
Apr 27, 2016
Sold by
Fhlmc
Bought by
Corliss John
Create a Home Valuation Report for This Property
The Home Valuation Report is an in-depth analysis detailing your home's value as well as a comparison with similar homes in the area
Home Values in the Area
Average Home Value in this Area
Purchase History
| Date | Buyer | Sale Price | Title Company |
|---|---|---|---|
| Schmerber John J | $364,521 | -- | |
| Harris Thomas M | -- | -- | |
| Corliss John | -- | -- |
Source: Public Records
Mortgage History
| Date | Status | Borrower | Loan Amount |
|---|---|---|---|
| Previous Owner | Harris Thomas M | $364,521 |
Source: Public Records
Tax History Compared to Growth
Tax History
| Year | Tax Paid | Tax Assessment Tax Assessment Total Assessment is a certain percentage of the fair market value that is determined by local assessors to be the total taxable value of land and additions on the property. | Land | Improvement |
|---|---|---|---|---|
| 2024 | $8,146 | $607,000 | $176,700 | $430,300 |
| 2023 | $7,448 | $533,500 | $154,600 | $378,900 |
| 2022 | $6,619 | $455,200 | $147,300 | $307,900 |
| 2021 | $6,218 | $400,100 | $147,300 | $252,800 |
| 2020 | $6,374 | $364,200 | $130,400 | $233,800 |
| 2019 | $6,373 | $339,000 | $118,500 | $220,500 |
| 2018 | $6,191 | $323,300 | $120,800 | $202,500 |
| 2017 | $6,143 | $323,300 | $120,800 | $202,500 |
| 2016 | $2,017 | $110,200 | $103,700 | $6,500 |
| 2015 | $3,071 | $172,500 | $120,800 | $51,700 |
| 2014 | $3,053 | $172,500 | $120,800 | $51,700 |
Source: Public Records
Map
Nearby Homes