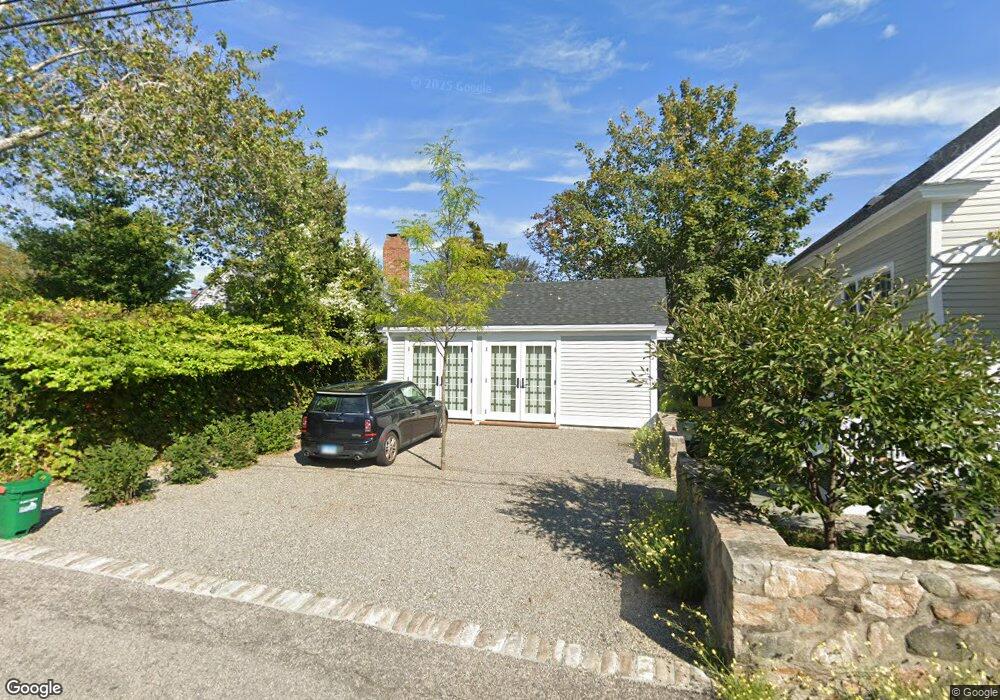
22 Wall St Stonington, CT 06378
Estimated Value: $1,276,000 - $1,510,943
2
Beds
4
Baths
1,638
Sq Ft
$843/Sq Ft
Est. Value
About This Home
This home is located at 22 Wall St, Stonington, CT 06378 and is currently estimated at $1,380,236, approximately $842 per square foot. 22 Wall St is a home located in New London County with nearby schools including Stonington Middle School, Stonington High School, and Pine Point School.
Ownership History
Date
Name
Owned For
Owner Type
Purchase Details
Closed on
Jan 16, 2025
Sold by
Mcclelland Nancy
Bought by
Nancy A Mcclelland Ret and Mcclelland
Current Estimated Value
Purchase Details
Closed on
Dec 22, 2022
Sold by
Nancy Mcclelland Lt
Bought by
Mcclelland Nancy
Purchase Details
Closed on
Aug 29, 2016
Sold by
Mcclelland Nancy
Bought by
Nancy Mcclelland Lt
Purchase Details
Closed on
Feb 2, 2004
Sold by
Guthrie Robert and Bourdeau Paul
Bought by
Guthrie Beatrice
Home Financials for this Owner
Home Financials are based on the most recent Mortgage that was taken out on this home.
Original Mortgage
$650,000
Interest Rate
5.82%
Create a Home Valuation Report for This Property
The Home Valuation Report is an in-depth analysis detailing your home's value as well as a comparison with similar homes in the area
Home Values in the Area
Average Home Value in this Area
Purchase History
| Date | Buyer | Sale Price | Title Company |
|---|---|---|---|
| Nancy A Mcclelland Ret | -- | None Available | |
| Mcclelland Nancy | -- | None Available | |
| Mcclelland Nancy | -- | None Available | |
| Nancy Mcclelland Lt | -- | -- | |
| Nancy Mcclelland Lt | -- | -- | |
| Guthrie Beatrice | $651,000 | -- | |
| Guthrie Beatrice | $651,000 | -- |
Source: Public Records
Mortgage History
| Date | Status | Borrower | Loan Amount |
|---|---|---|---|
| Previous Owner | Guthrie Beatrice | $650,000 |
Source: Public Records
Tax History Compared to Growth
Tax History
| Year | Tax Paid | Tax Assessment Tax Assessment Total Assessment is a certain percentage of the fair market value that is determined by local assessors to be the total taxable value of land and additions on the property. | Land | Improvement |
|---|---|---|---|---|
| 2025 | $15,750 | $774,200 | $471,000 | $303,200 |
| 2024 | $14,157 | $726,000 | $471,000 | $255,000 |
| 2023 | $14,266 | $726,000 | $471,000 | $255,000 |
| 2022 | $12,271 | $514,900 | $338,700 | $176,200 |
| 2021 | $12,339 | $514,400 | $338,700 | $175,700 |
| 2020 | $13,560 | $514,400 | $338,700 | $175,700 |
| 2019 | $13,560 | $514,400 | $338,700 | $175,700 |
| 2018 | $13,158 | $514,400 | $338,700 | $175,700 |
| 2017 | $12,398 | $480,000 | $362,900 | $117,100 |
| 2016 | $12,053 | $480,000 | $362,900 | $117,100 |
| 2015 | $11,397 | $474,500 | $362,900 | $111,600 |
| 2014 | $10,513 | $458,500 | $362,900 | $95,600 |
Source: Public Records
Map
Nearby Homes